
Focus: Renewable Energy - What to Watch?
Joseph Morgan and Yao Wang

The changing energy source: from fossil fuels to renewables
There might be a thousand reasons to roll your eyes on energy transition from fossil fuels to renewables. It takes a long time, requiring lots of money, and we are only making baby steps so far. Fossil fuels still account for 79% of total energy consumption in 2020, not much different from the 80% 10 years ago.
However, the one reason that keeps drawing our attention on energy transition is the fact that relying on fossil fuels is not sustainable in the long run, and a dramatic change in the energy map is thereby inevitable.
The roadmap to achieve “Net Zero in 2050” (carbon neutrality) proposed by the International Energy Agency (IEA) might seem too aggressive to many of us. However, we can ignore the timeline, and look at the “Net Zero” as the “final state condition” of the energy sector: if not in 2050, then in “20X0”.
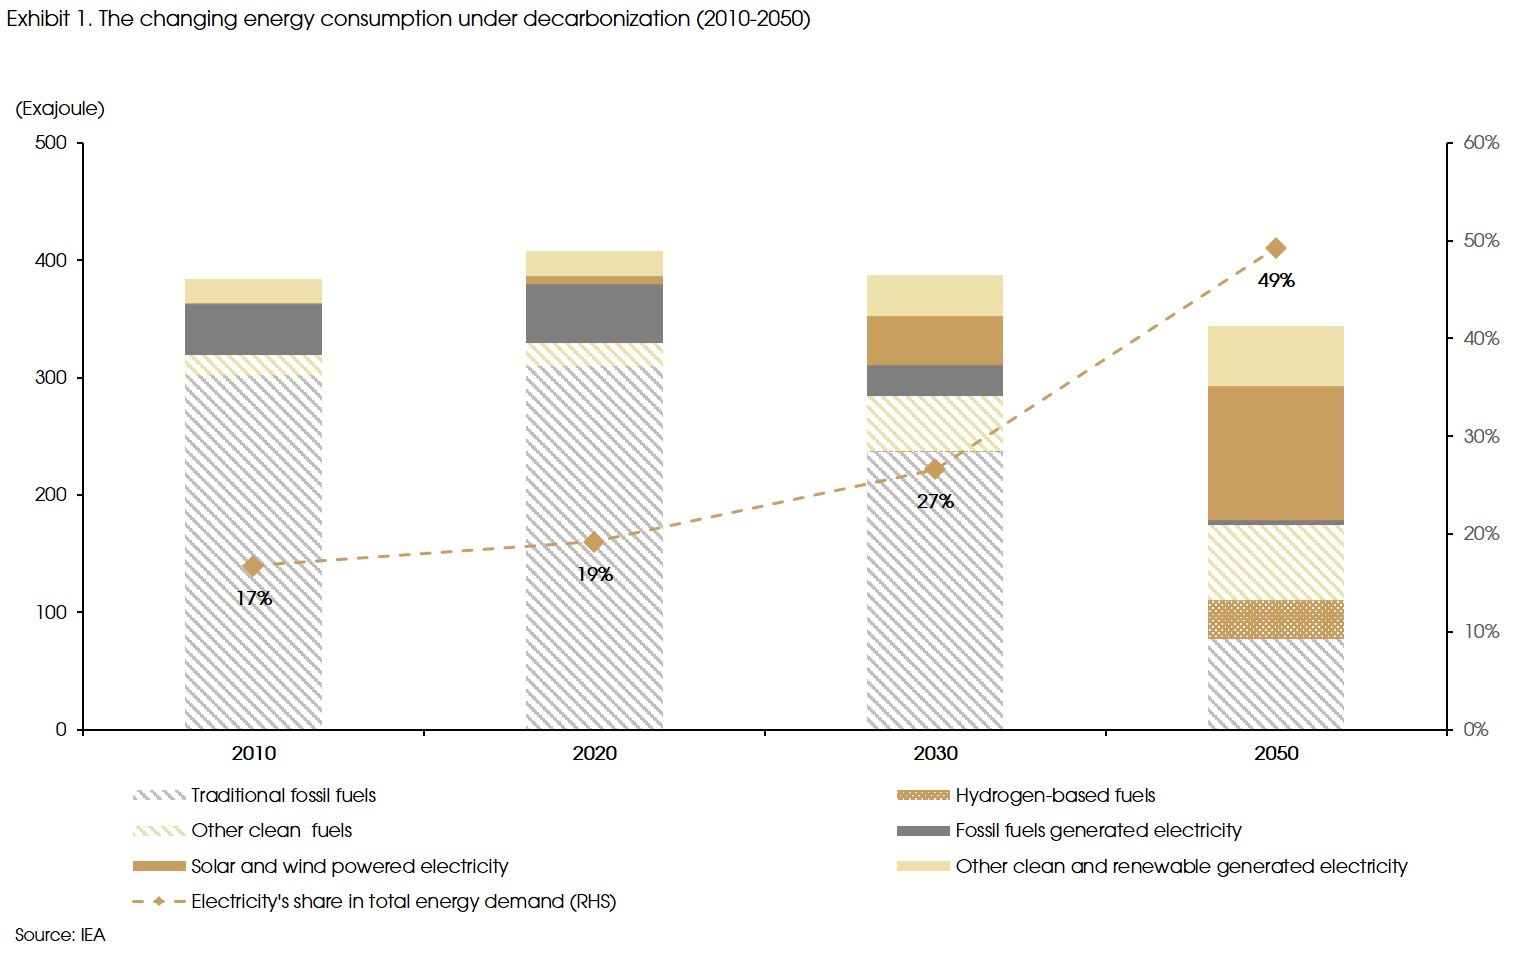
Three aspects in the final state condition merits particular attention (Exhibit 1).
(1) Electrification plays the key role in the energy transition. Final consumption of electricity will need to increase from the current 19% to 49% under the “Net Zero” scenario.
(2) Electricity will mainly be generated from renewable energy, especially solar and wind. Currently, 36% of electricity is generated from renewable energy sources (e.g., hydro, solar, wind, and nuclear). However, in the final state of carbon neutrality, the share will increase to 90% with solar and wind accounting for 70% of electricity generation.
(3) Hydrogen also sees a huge jump, by increasing from almost zero to accounting for 33 exajoule as clean fuels consumption.
We are slightly more positive than some market views on the energy transition.
From the policy side, the Paris Agreement has been increasingly mentioned in international forums and meetings. Major governments and large companies have set ambitious goals to achieve carbon neutrality with considerable investments. Therefore, the energy reform might come sooner rather than later.
Despite the policy goals, renewable energy sources begin to make sense economically, as clean energy costs continue to decline due to technological advancement. For example, the levelized costs (total cost including the expense of building the facility and energy produced during the facility's lifetime) for solar PV and onshore wind turbines have declined by 80% and 25%, respectively, during the past decade, and have become cost-competitive with fossil fuels (according to IRENA).
Supported by both policy and the declining costs, we see faster than expected commissions of renewable capacity in major markets during the past several years. Around 240 gigawatts (GW) of solar and wind capacity was added globally in 2020, an increase of almost 50% from 2019. Meanwhile, capital additions of fossil fuels fell from 64 GW to 60 GW in 2020.
For the rest part of the focus, we take a more detailed look at solar, wind, and hydrogen sectors, focusing on their recent developments.
Solar photovoltaic global supply value chain versus demand mismatch
Since the early 2000s, China has recognized the strategic importance of the solar industry. Therefore, over the past fifteen years, they have gone from almost no presence to dominating the entire global solar photovoltaic value chain.
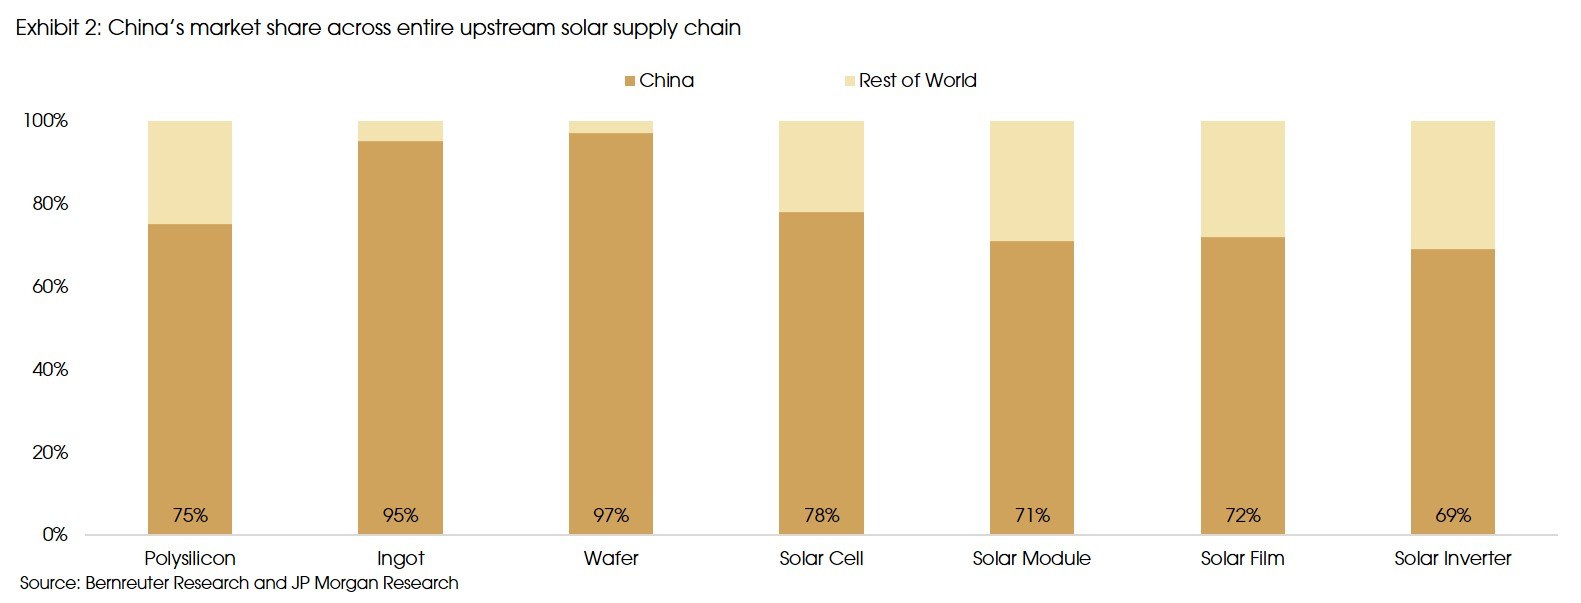
As shown in Exhibit 2, China produces at least 70% of each part of the solar supply chain. Even though, China also has a large demand for solar photovoltaics, their production extends significantly beyond the amount they actually consume within their country. In 2020, China made up around 35% of global demand for solar photovoltaics.
The solar value chain can be broken up into different segments with different players focusing on each segment. Over the next sections, we aim to explain each part of the value chain and the current dynamics.
Polysilicon
Around 95% of solar modules currently rely on one primary resource, polycrystalline silicon (polysilicon). Polysilicon is produced by processing raw materials, quartz. Polysilicon is used to make solar panels as well as semiconductors.
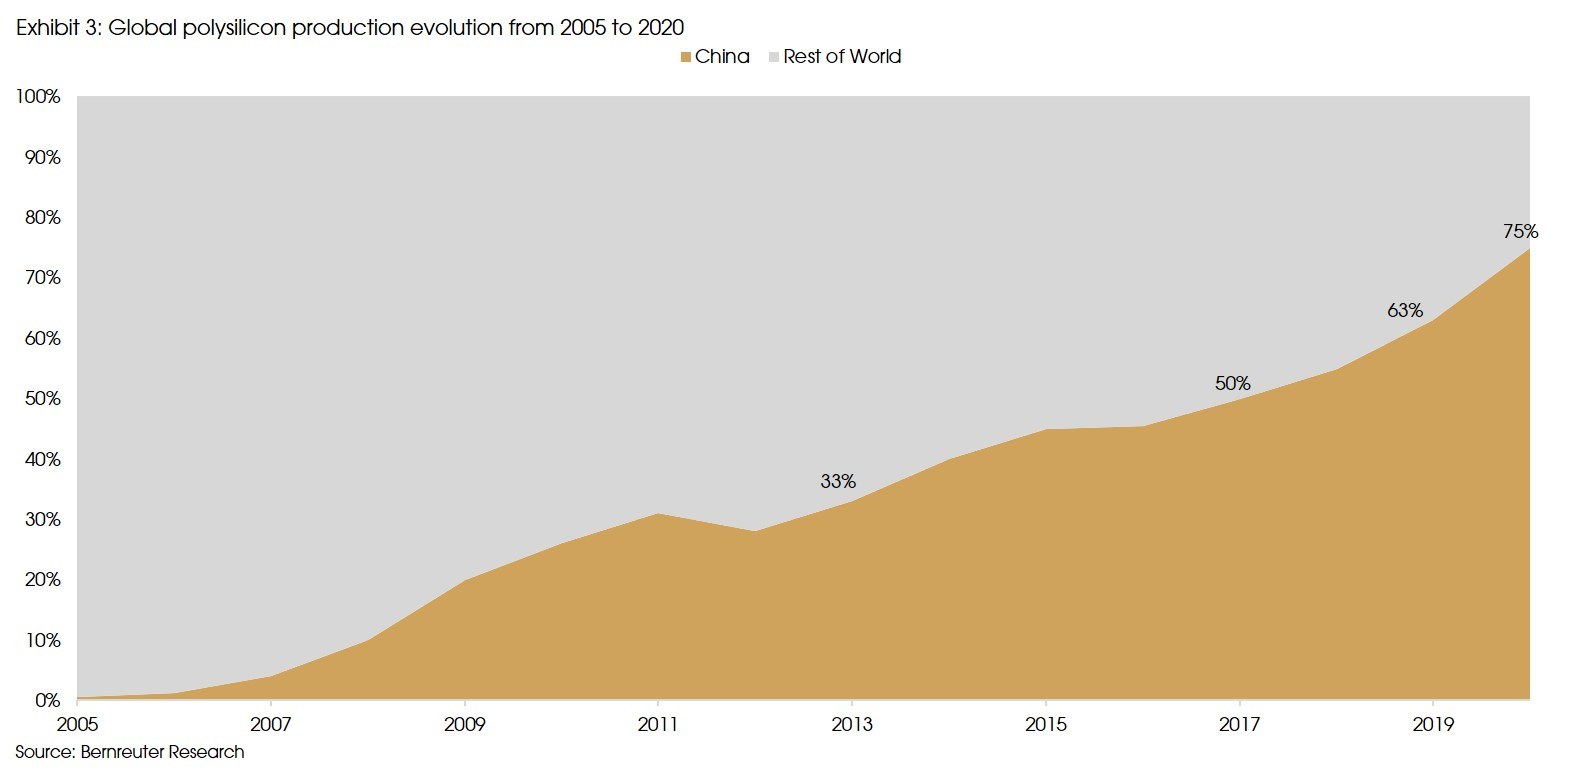
As shown in the exhibit above, China’s production of polysilicon expanded significantly. In 2013, when China’s production accounted for around 33% of global production, the Chinese government introduced duties on polysilicon imports from the United States and South Korea. In 2016, there was a further push, particularly by the Xinjiang Party Committee for the region to ramp up polysilicon production. The government promised subsidies and tax incentives. The access to cheap energy prices in the Xinjiang region in particular helped to incentivize Chinese companies’ polysilicon production capacity expansions. Currently China’s polysilicon manufacturers rank as five of the top six highest-capacity polysilicon producers.

The total capacity of these six companies in 2020, is equivalent to almost the entire global capacity in 2015. These companies still have planned capacity increases. For example, Daqo and Tongwei currently have announced plans to increase capacity by 35,000 and 85,000 metric tonnes respectively by the end of 2021.
The incentives and access to cheap energy prices have placed substantial pressure on foreign players. In early 2020, two Korean companies, OCI and Hanwha solutions, declared that they would shut their polysilicon production facilities in Korea. Wacker is also continuing to face pressure.
Polysilicon prices, as with most other raw materials, have since seen significant increases this year. The prices have doubled year to date due to supply tightness. This is expected to be short-lived though as capacity expansion plans are on the way. Capacity is expected to increase by around 30% by early 2022, which should alleviate the current supply tightness.
Given the limited potential for technology and cost differentiation among players in this segment, the focus should be placed on the larger players who can benefit from economies of scale.
A risk to demand growth of polysilicon is technology improvements. Wafers are continually becoming thinner, which thus requires less polysilicon. In 2001, almost 16 grams of silicon was required per watt produced of solar cells. This has declined by over 80% to now around 3 grams of silicon required per watt produced of solar cells.
An additional risk that the Chinese companies face are geopolitical ramifications surrounding Xinjiang. Currently around 45% of global polysilicon production is estimated to be produced in the region. Most of the Chinese companies are either based in or have extensive production capacity in Xinjiang. With growing criticism from the US and Europe regarding human rights violation, this could place pressure on the valuations of companies with exposure to this region, particularly those listed in the US.
Ingots and Wafers
Polysilicon is processed into ingots, which are then sawn into square bricks and sliced in thin silicon wafers. This part of the solar supply chain is practically dominated by China.Even within China, there are only a few players focused on this segment. According to the China Photovoltaic Industry Association, the market concentration ratio for the top five players in the wafer production sector is 88%. There are two main types of wafers: monocrystalline (mono) and multicrystalline (multi). Mono was consistently considered more efficient in solar panels than multi. However, only until the past few years have the technological improvements been made to make mono an equivalently economical option versus multi. One Chinese company, LONGi, which made the bet on mono technology a few years ago has benefitted and is now the largest mono-wafer provider with cost and technological advantages. The market share that the mono-wafers are taking of the wafer market is still on an upward trajectory. In 2020, the total production of mono-wafers has just surpassed the total production of multi-wafers in that year.
Solar Cell and Modules
Solar cells are produced by doping wafers. The doping process is used to regulate the structural and electrical properties of the wafer. The cells are then wired , connected and mounted to becoming a solar module. This is essentially almost the ‘final product’ of the solar panel as we know it. This segment faces the greatest competition. China owns around 78% of solar cell production, with countries including South Korea, Taiwan and Canada making up the remainder. According to the China Photovoltaic Industry Association, the market concentration ratio for the top 5 players in the solar cell and module production is 53% and 55% respectively. China will unlikely be able to increase their market share of these two segments. This is particularly due to the US and European Union placing anti-dumping duties on Chinese manufacturers. Most notably, they have created facilities in Malaysia and Vietnam. This can be seen in US trade data as well. According to US International Trade Commission, in 2020 Vietnam and Malaysia made up over 50% of solar module imports into the US, and South Korea made up over 50% of solar cell imports.
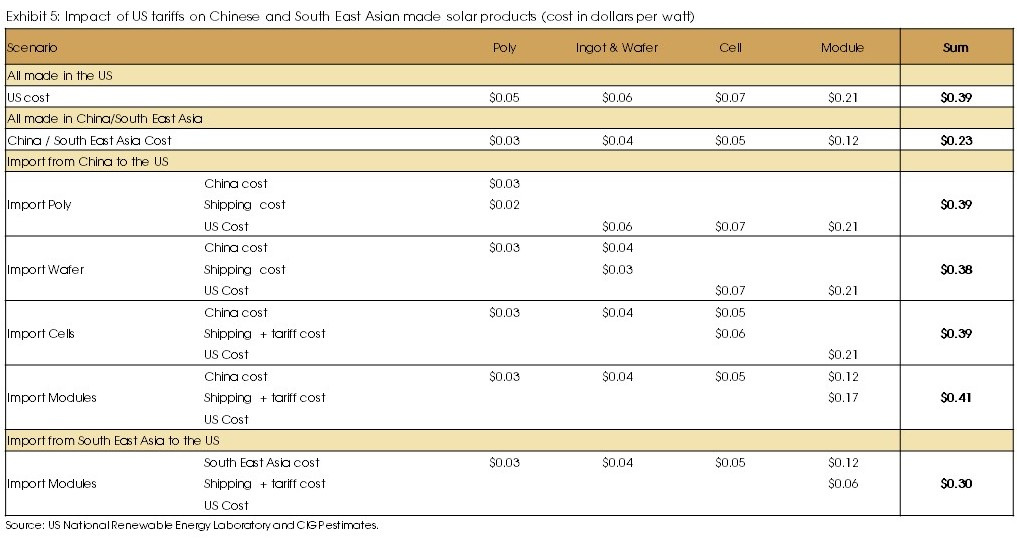
Substantial improvements have been made to solar photovoltaic technology. However, advancements and discoveries are continuing to be made in order to improve the efficiency of solar panels. The solar module and solar cell segment is at greatest risk of technological disruption. Currently there are already a couple of new technologies being developed which have greater efficiency than the current solution. It is not clear though whether these will become as economically viable.
Solar Film and Glass
Solar cells are laminated with films on both the front and back to protect the cells. They are used to protect them from adverse weather conditions as well as preventing moisture and dirt from penetrating the modules during the 20 to 25 year lifespan. Solar glass is then placed on top of the solar film and cells to enclose the entire module. This segment is highly concentrated in a few players, mainly due to the stickiness of the product. The solar module lamination process is irreversible. Thus, module makers are extremely cautious in choosing solar film suppliers and will typically stick with them for a long time once settled. Solar glass production is concentrated in two main players. In general, solar glass does have a track record of a more stable pricing environment versus polysilicon, while the volume growth is driven by greater demand for solar photovoltaics. Moreover, given the growing demand for bi-facial solar photovoltaics, the companies that have the capabilities to produce the required solar glass from these cost-effectively will be able to gain further market share.
Solar Inverter
The power that is generated from solar panel is direct current (DC) which cannot be directly fed into electrical grids. Solar inverters are required to be connected to solar panels in order to convert the DC into a utility frequency alternating current (AC).
There are two main types of inverters: string inverters and central inverters. In 2020, the breakdown of inverter demand by type of inverter was 60% for string inverters, growing from 33% in 2016, while central inverters market share was around 35%, declining from 57% in 2016.
String inverters have been gaining market share due to several reasons:
- Technological improvements reduced the DC to AC conversion loss.
- These inverters also have a better solar energy harvest due to the fewer number of strings.
- Much wider application. String inverters are smaller and each unit converts a smaller amount of power versus a central inverter. Therefore these can be used in smaller rooftop solar installations or in solar farms if they want to reduce redundancy.
The lifecycle of an inverter is shorter than a solar panel. Inverter lifecycle is 10 years versus 25 years for a solar panel. Therefore, as solar installations increase, this should also increase the demand for solar inverters.
Wind turbine production: localized and centralized
The wind turbine supply chain is very different from solar. Wind turbine production is centralized in single players. It is not broken up into different parts and players. Production market share by companies’ country of origin, and these companies manufacturing facilities are also a lot more evenly distributed across the globe.
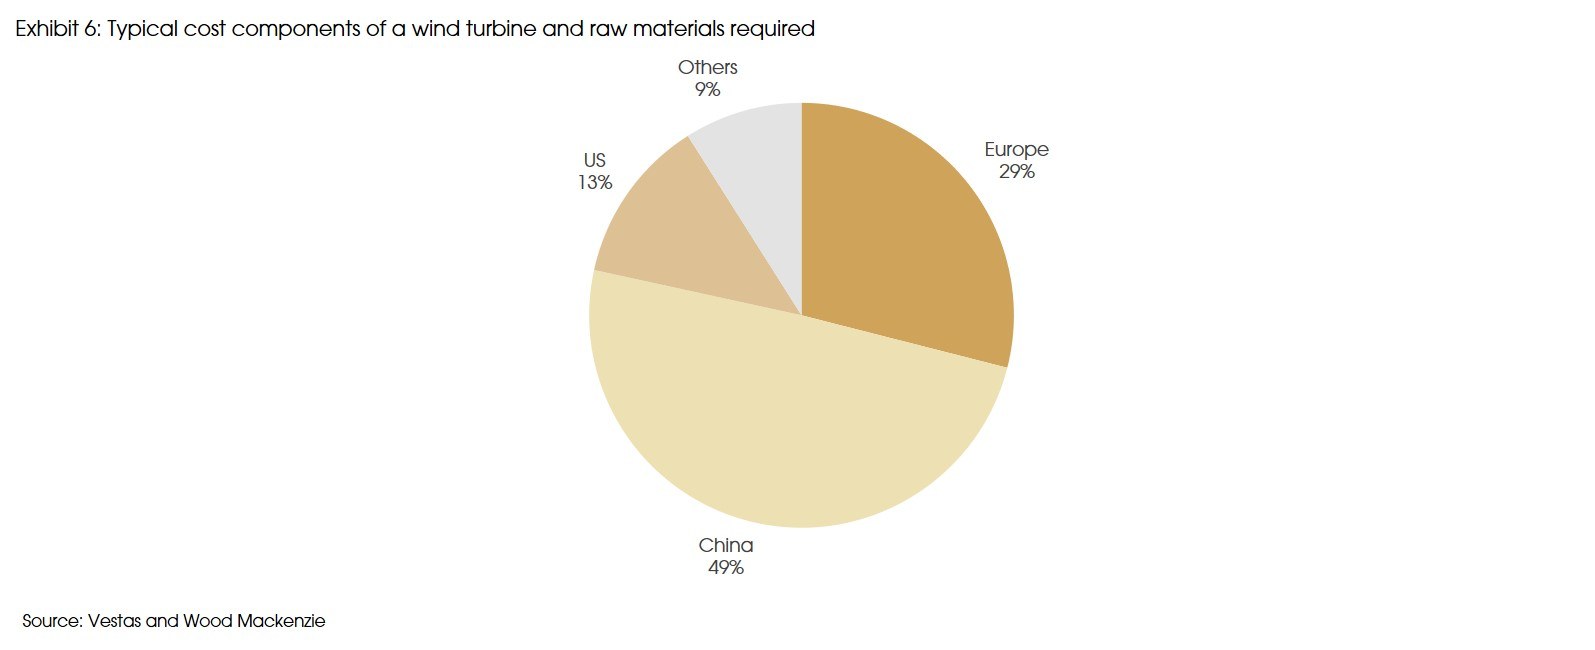
As shown in Exhibit 6, Chinese companies have the largest share of wind turbine production. However, this is consistent with their demand. In 2020, 93 gigawatts of new wind power was installed, and China made up around 56% of the total installations. Chinese wind turbine manufacturers, a few being private non-listed companies, have remained partially isolated from the global market. National manufacturers cover almost all-internal demand and have very few exports to other markets.
Wind turbine manufacturers are generally required to set up facilities near demand. This is due to the issue of transportation of bulky parts. For example, one 150 MW wind farm in the US required 689 truckloads, 140 railcars and 8 vessels to transport all the necessary materials. In order to minimize transportation costs, each manufacturer, particularly the large Western manufacturers such as Vestas, Siemens Gamesa and General Electric, have manufacturing facilities around the world.
In particular, the European manufacturers have been increasing production capabilities in India over the past two to three years. This is due to cost consideration and the supply of strong local engineering skilled labor. With the current COVID situation still not improving in India, this has now become a risk, due to the increased reliance on the Indian supply chain.
Wind turbines and raw materials
Turbines, including towers and installation, are the main cost components in developing wind farms. The turbines can account for 64% to 84% of an onshore wind project’s total installed cost. The turbine cost fluctuates with economic cycles and the price of commodities, such as steel and copper, which constitute a significant portion of the turbine’s materials.

In the past 6 to 7 months, the prices of raw materials have seen sharp increases, as we have also written about in our past viewpoint (link). In particular metal prices, such as steel (made from iron) and copper, which are required across a number of different alternative energy sources and infrastructure, have seen a surge in prices. We expect this to continue.
Steel is the principal commodity used in a wind turbine. The towers in particular have the single largest exposure, with steel accounting for 45% to 60% of the input cost, depending on the height of the tower. Copper, although not as large a component of costs versus steel, can also be a headwind for producers. In particular, given the use of copper across many different types of green technologies, this has led to a surge in prices year to date.
Epoxy resin is essentially an adhesive. This is used in blade manufacturing and is estimated to account for around 3% of total turbine costs. Even though this seems like a small production cost, year to date, epoxy prices have increased by over 40%. This price increase alone can lead to an increase in the cost of manufacturing the turbine by over 1%. This is due to a supply-side shock, including the deep freeze in Texas that impacted production and an increase in demand as resin is also used for general construction activity.

Headwinds to onshore wind
Manufacturers’ backlog of onshore wind turbines is at greater risk of margin pressure from these increased raw material prices versus the backlog of offshore wind turbines. The reason for this is due to the different agreement structure.
Wind farms are typically project based. Manufacturers of the wind turbines will have to quote a price as early as 12 to 18 months before installation activities begin. The wind farm operators will use these quoted prices to create their budget and once all permits are secured, they will then place firm orders with the wind turbine manufacturers. Once a firm order is placed though, price renegotiation is typically not an option. As a result, the impact of the increase in raw material prices will have to be borne by the manufacturer.
This is not as much the case for offshore. Due to the longer lead times in offshore, typically there will be an indexation mechanism that is agreed between the manufacturer and wind farm operator. This mechanism will thus pass more of the commodity price increases onto the customer. Moreover, offshore wind in general will tend to have an even lower reliance on inter-continental flows of goods.
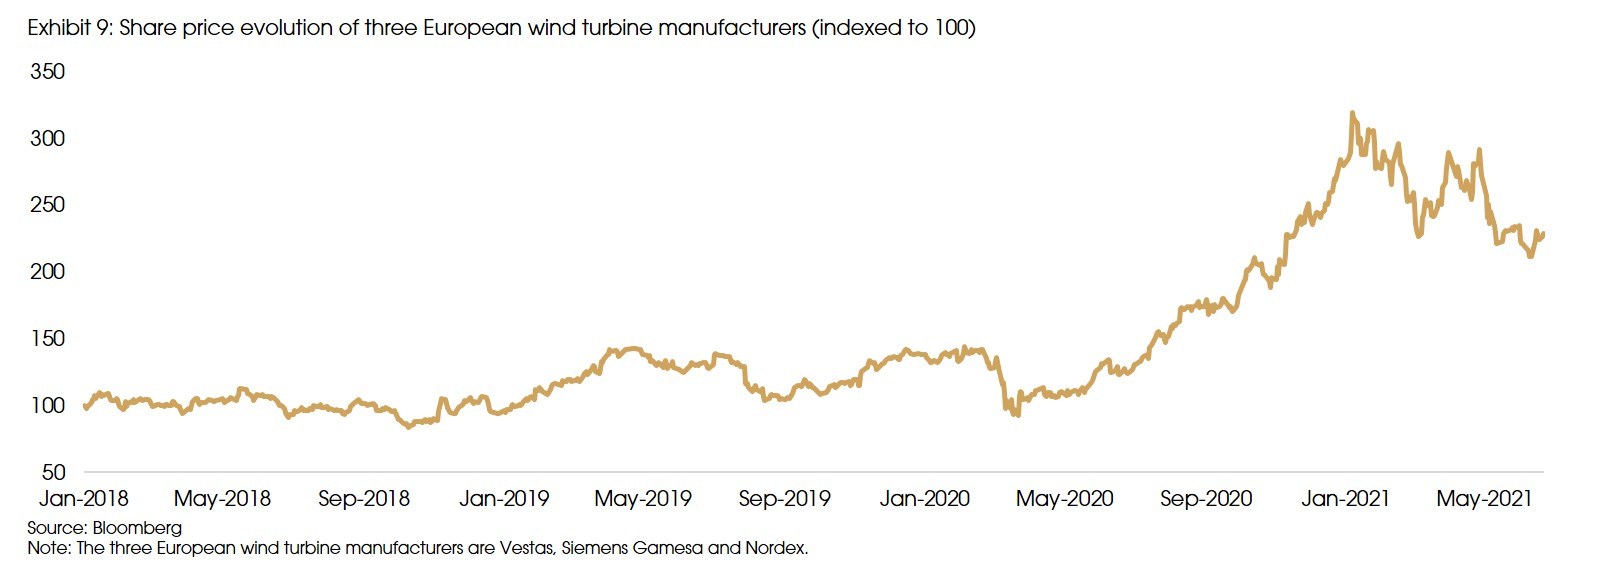
These pressures have to a certain extent been taken into consideration by the market. We analysed the share price evolution since January 2018 of three key European wind turbine producers and noted that they have very similar performance over the period. All three of these companies, including the largest Chinese wind turbine producers, have seen their share price drop by 25% to 33% since the early January peak. The only exception to this is General Electric, which has other sector exposures.
Continued reduction in LCOE expected
Wind energys’ levelised cost of energy (LCOE) has experienced accelerated cost reduction from 2015 to 2020. This reduction was far greater than predicted by a survey conducted by the National Renewable Energy Laboratory (NREL) in 2015 of 140 global wind experts.
In 2020, the NREL conducted another survey of 140 global wind experts. The experts predicted a further 37% to 49% decline in wind LCOE by 2050. A main contributor of this reduction in LCOE is the growth in turbine size. The experts in particular have become even more optimistic about further growth in turbine capacity ratings, hub heights and rotor diameters.
Implications for solar and wind upstream players
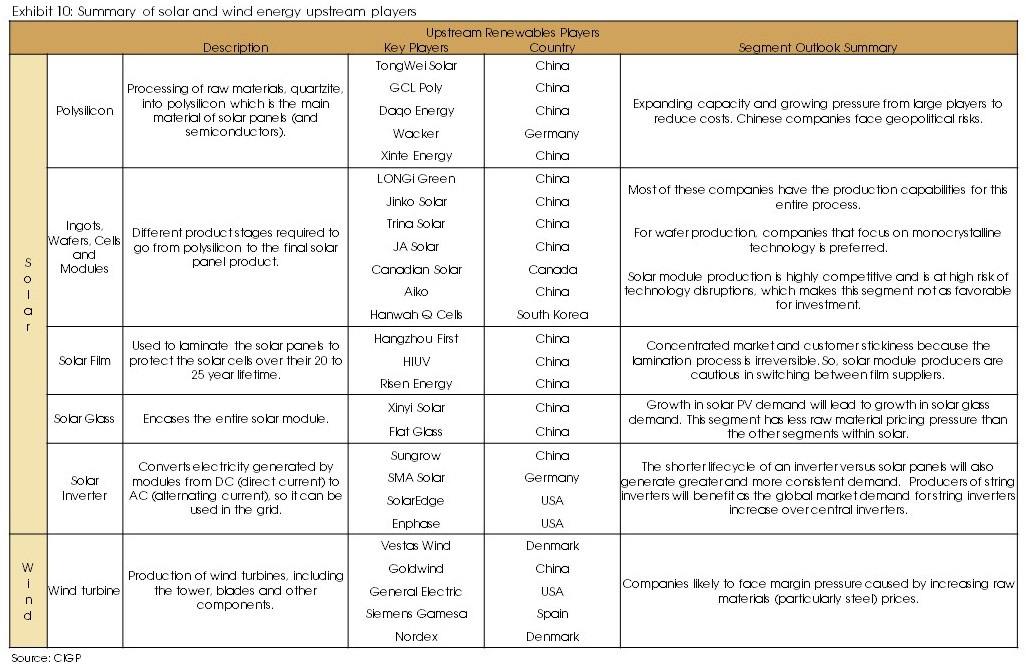
The need for both solar photovoltaic, on-shore and off-shore wind to enable the goal of reaching carbon neutrality is undeniable. However, we believe that there are certain segments within the upstream players which may be less prone to disruptions and therefore may be more interesting to further examine.
Green hydrogen: the last mile driver for decarbonization
Around 80% of the economy are relatively easier to be decarbonized through electrification. For example, most power generation can be decarbonised by transition to renewables; most passenger cars can be replaced by electric vehicles, and most manufacturing processes (as long as high temperatures are not necessary) can also be largely electrified.
However, around 10-20% of the economy is trickier to be decarbonized through electrification. (1) Power generation cannot be 100% reliant on renewables. Seasonal storage and backup are needed for peakload. (2) Heavy-duty vehicles, ships and airplanes cannot be fully electrified, as the batteries needed will be too heavy. (3) High-temporature manufacturing process (e.g., steel) cannot be powered by electricity.
Therefore, low-emission, clean fuels are needed to address the “last mile” of decarbonization. Hydrogen can be the source.
First, hydrogen and hydrogen-based fuels are clean energy carriers, which will not generate carbon dioxide during use.
Second, hydrogen has one of the highest energy densities. Its calorific value per unit mass is about 4 times that of coal, 3.1 times that of gasoline, and 2.6 times that of natural gas. When compared with conventional lithium-ion batteries, hydrogen has about 200 times higher energy density (according to IEA). This characteristic is especially desirable to power heavy-duty vehicles.
Moreover, the use of LOHC (Liquid Organic Hydrogen Carrier) for hydrogen storage and transportation well addresses the issues of safety, reversibility, longevity, low cost, and could utilize the current gas fueling infrastructure.
Given these properties, hydrogen is particularly suitable to power the “last mile” decarbonization. It can work as a complementary clean energy source, together with electricity, to achieve the “Net Zero Emission” in the long run.
Current bottlenecks: carbon emission during production and high costs
Hydrogen itself is “clean”, but different production processes may result in significant variance on carbon emissions.
Hydrogen produced by fossil fuels is called grey/brown hydrogen. For now, 98% of hydrogen is derived from fossil fules, resulting in large amount of carbon emissions.
However, by adding one layer of CCUS (carbon capture, utilization, and storage) to the grey/brown hydrogen production process, carbon emission can be captured and stored in underground reservoirs, reducing emissions. Hydrogen produced with CCUS is called blue hydrogen.
Although blue hydrogen is already much “cleaner” than grey/brown hydrogen, it still relies on fossil fuels as input.
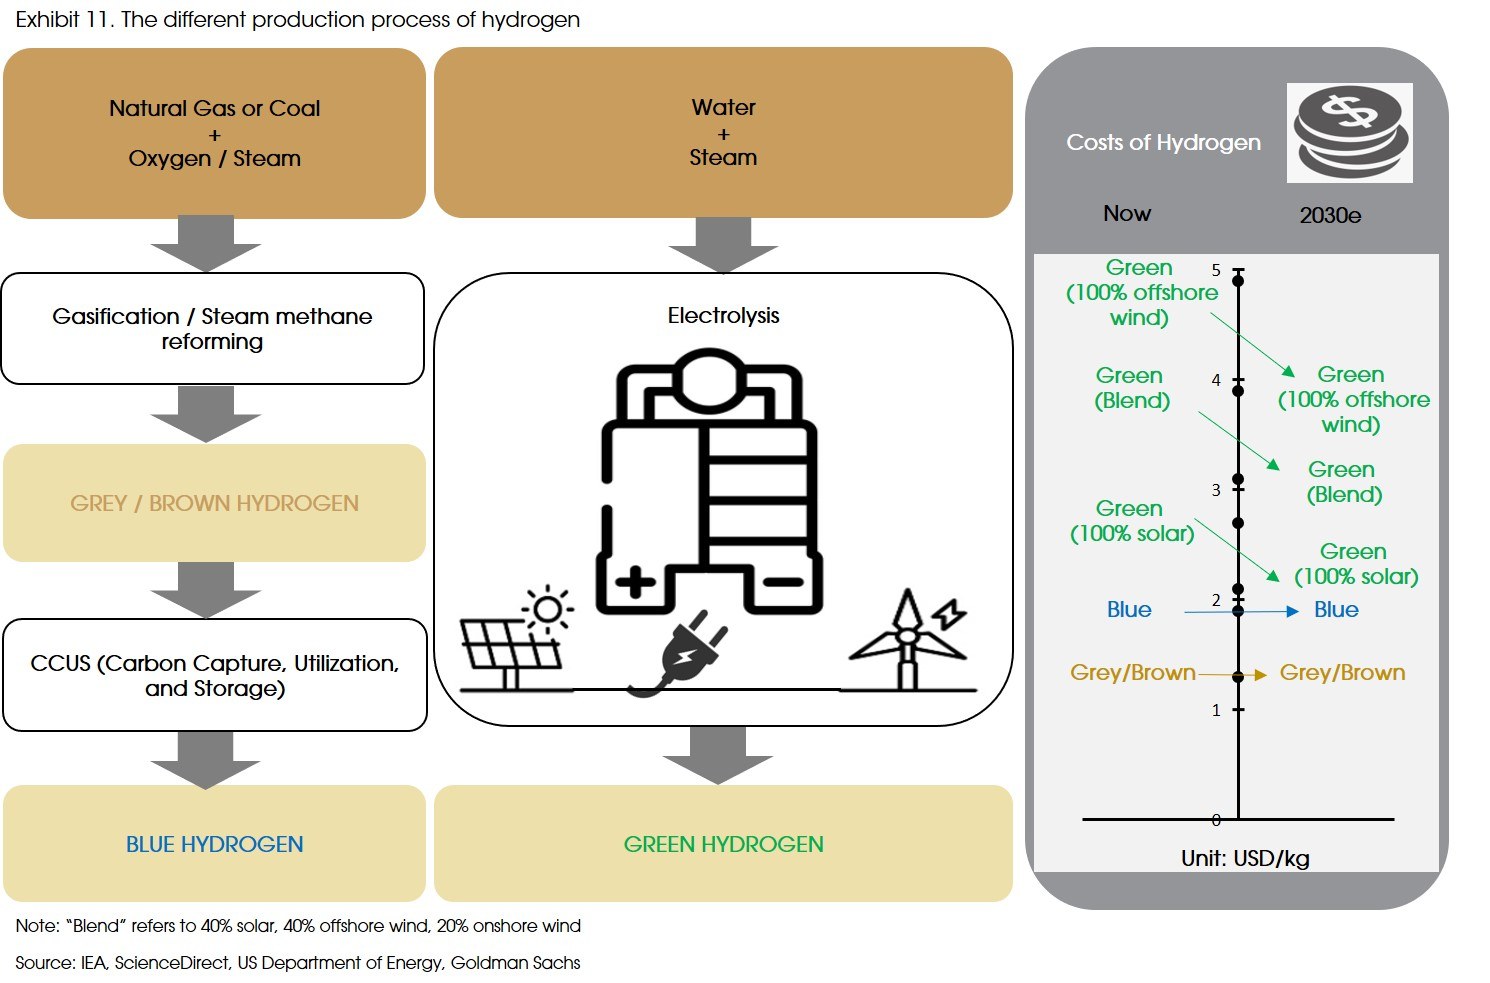
The ideal way (and the future trend) to produce hydrogen is through the electrolysis process, powered by electricity from renewable sources (e.g., solar and wind). Such a process is entirely clean, and hydrogen produced this way is called green hydrogen (Exhibit 11). However, currently, green hydrogen only accounts for 2% of total production, as both the electrolysers and the solar/wind-generated electricity are too expensive to make any economic sense for end-users.
Electrolysis is very electricity-intensive, with 80% of the levelized cost of green hydrogen coming from electricity. The levelized cost for green hydrogen is around 2-4 times higher than that of grey/brown or blue hydrogen, depending on which renewable source is used as electricity supply (Exhibit 11, right panel): solar is the cheapest, while offshore wind is the most expensive.
That said, going forward, the levelized cost may decline, making green hydrogen more competitive.
First, as we have mentioned above, the cost of electricity generated by solar and wind (especially solar) should continue to decline due to technological advancement and production scale-up.
Second, the cost of electrolysers may also decrease due to the economies of scale and localized production of the key materials (according to Goldman Sachs). Actually, during the past decade the cost of electrolysers has already decreased by around 60%.
Therefore, the levelized cost of green hydrogen is expected to fall significantly, with the 100% solar-power electrolyzed hydrogen most likely to challenge blue hydrogen in the coming decade (see the “2030e” in Exhibit 11).
Moreover, potential government policies, such as taxes on carbon production/emission and tariffs on imported natural gas, could increase the cost for grey/brown and blue hydrogen, further narrowing the cost gap.
Thus, we expect the cost attractiveness of green hydrogen should continue improving, and its market share should increase significantly in the long run.
The expanding market and the players
Green hydrogen has a minimal presence compared with other sources of renewable energy. The current total capacity of hydrogen electrolysis is only around 100 megawatts (MW) globally (compared to the 93 GW wind power capacity added in 2020).
However, the market is set for rapid growth. According to IEA, 538 MW hydrogen electrolysis project is scheduled to be commissioned as early as 2023, and the currently announced projects could probably lift the total capacity to 30 GW by 2030. Meanwhile, green hydrogen production should increase from the current 0.45 million tonnes per year to 81 million tonnes in 2030.
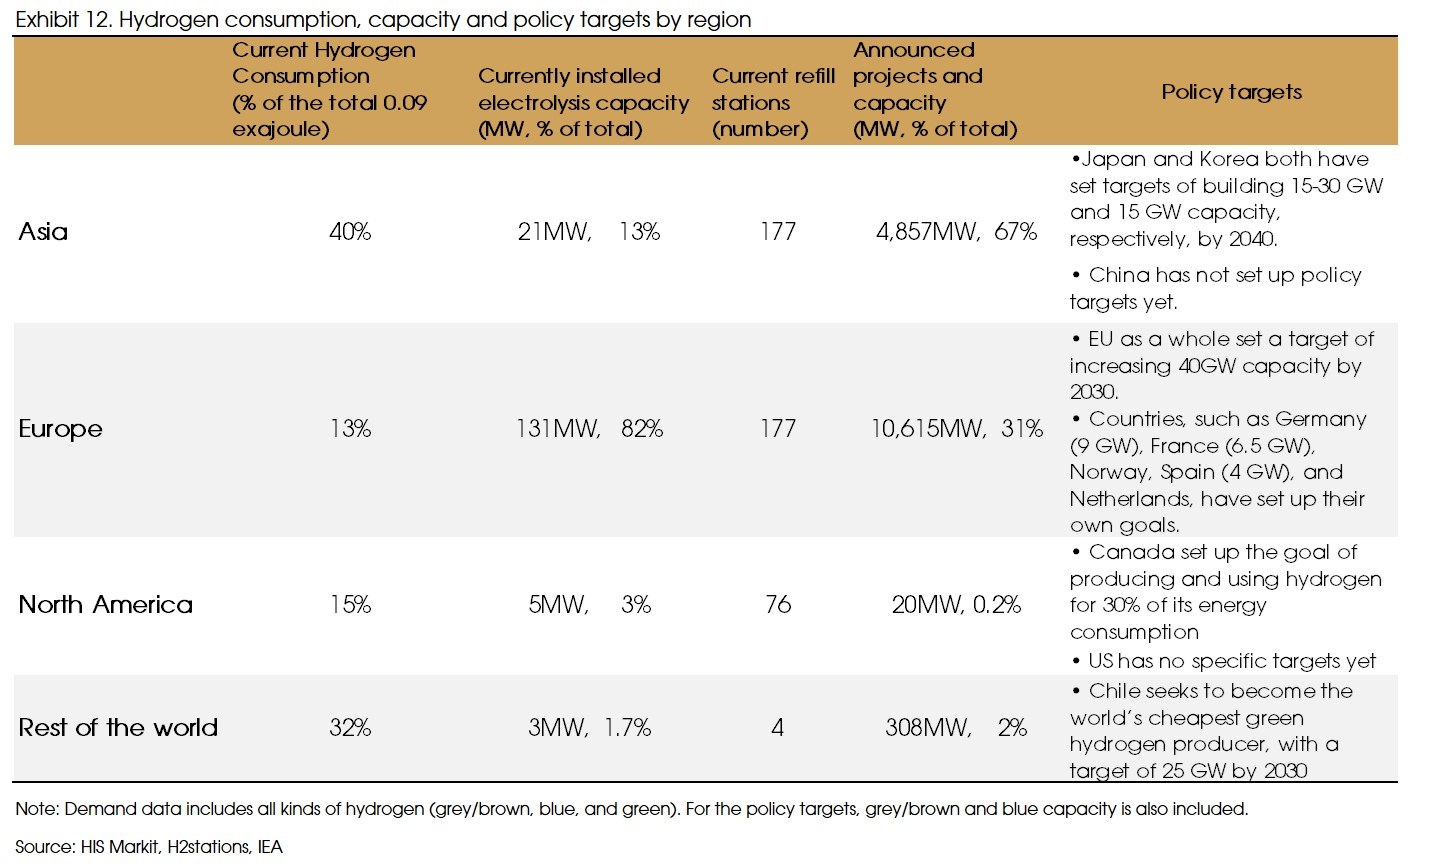
Unlike the significant footprints of Asia in solar and wind sectors, green hydrogen is more of a “European story”. 60% of the current global electrolysis capacity is Europe (the installed capacity is larger, and the EU accounts for a even larger share), which will remain unchanged in the foreseeable future, seen from the announced projects (Exhibit 12).
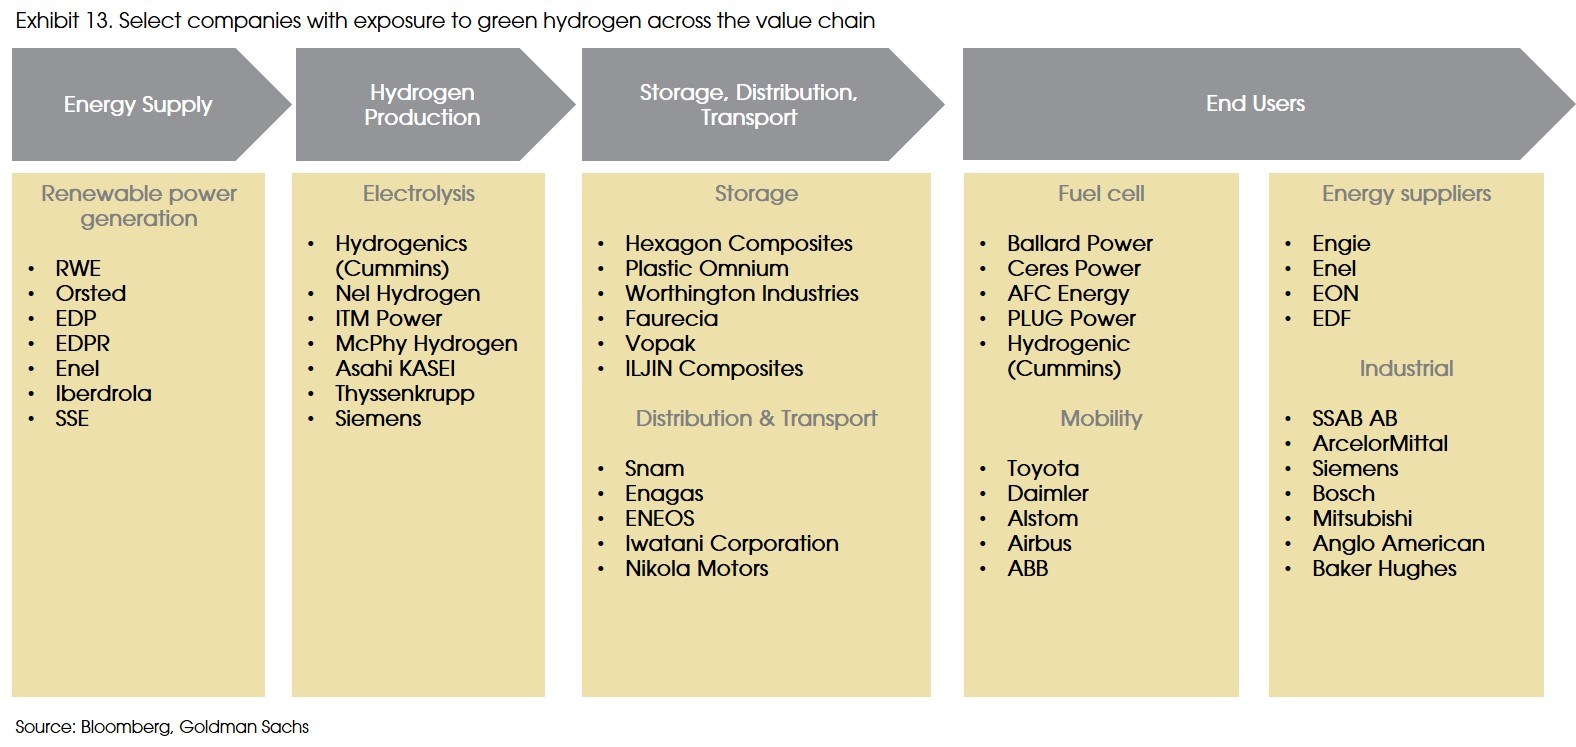
We try to list some players along the green hydrogen value chain (Exhibit 13). The ecosystem mainly include: upstream renewable power suppliers, electrolyzer manufacturers, the infrastructure providers (storage, distribution & transport), and end users (e.g., fuel cell manufacturers, automakers, and energy and industrial companies).
Considering that the sector is still at a very early stage, most companies along the value chain are not dedicated green hydrogen companies (or pure players), but rather, just demonstrated some commitments to hydrogen, with limited exposures. For example, Orsted, the Danish company which has transformed from fossil fuels to offshore wind and accounts for around 24% of the offshore wind market outside China, has announced plans to develop the world’s largest hydrogen electrolysis plant powered by offshore wind turbines, but its main business (90% of EBITDA) is still offshore wind.
The dedicated, pure hydrogen players are mainly within the electrolyzer and fuel cell manufacturers. For example, ITM Power is a electrolyzer manufacturer with a gigawatt-factory, and Ballard Power, Ceres Power, AFC, and PLUG Power are all hydrogen fuel cell companies.
Implications for investment
To take opportunities in the growing hydrogen market, several options can be considered.
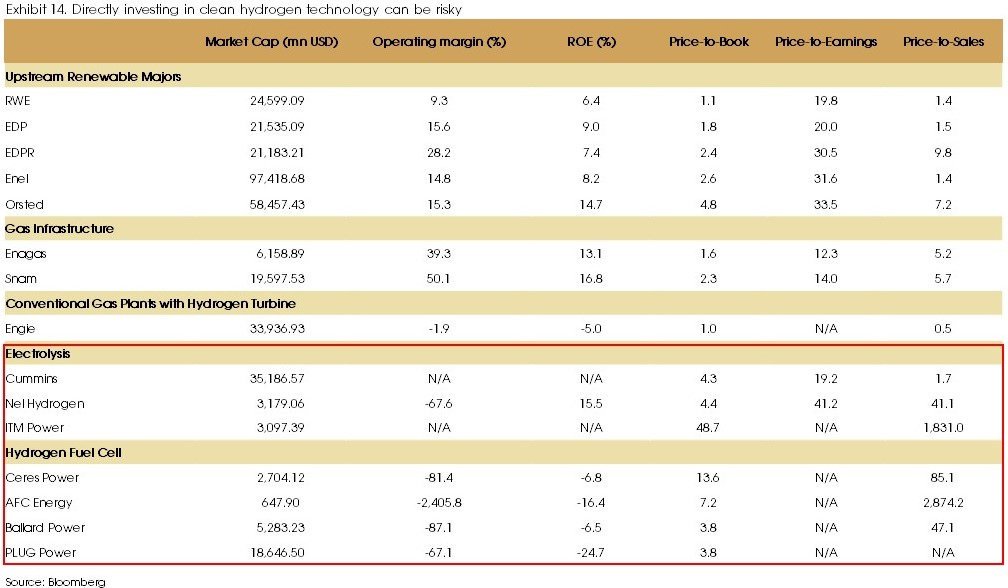
1) Hydrogen electrolysis and fuel cell technology are very niche technology, which has not been fully commercialized yet. It is hard to predict any earnings contribution from the hydrogen pure players (i.e., the electrolyzers makers or fuel cell makers). Given the fast growing outlook, valuation expansion (partly derived on market sentiment) is the main driver for the performance of these hydrogen companies. As a result, their prices can be very volatile. Moreover, after last year’s rally, most of these companies are traded at high multiples, which can be risky (Exhibit 14, lower part).
2) Other than the pure players, the upstream renewable power providers seem attractive. Most of these companies have good profit margins and reasonable valuations (Exhibit 14, upper part). More importantly, due to the electricity-intensive nature of the green hydrogen sector, the potential fast growth of hydrogen production indicates huge demand for electricity that needs to be met via renewable sources, which will significantly benefit the renewable majors.
(3) Other opportunities stem from gas grids reconfiguration and conventional gas plants trying to develop Hydrogen Turbines.
Sources: International Energy Agency, Goldman Sachs, Bloomberg NEF, International Renewable Energy Agency, Absolute Return Partners. Bernreuter Research, Bloomberg, China Photovoltaic Industry Association, JP Morgan Research, National Renewable Energy Laboratory, Novergy Solar, PV Magazine, Siemens Gamesa, US International Trade Commission, Vestas Wind, Wood Mackenzie and CIGP Estimates.


