
CIO Viewpoint: 2H 2021 - The Fading Cyclical Tailwind

For the first half of this year, global economy has recorded a faster than expected growth, due to the smooth vaccine rollout and supportive policies from major economies. According to the IMF, global GDP is expected to increase by 6% in 2021 (compared with 5.5% predicted at the end of 2020), with the growth of developed economies recovering from -4.7% in 2020 to 5.1% and emerging economies from -2.2% to 6.7%.
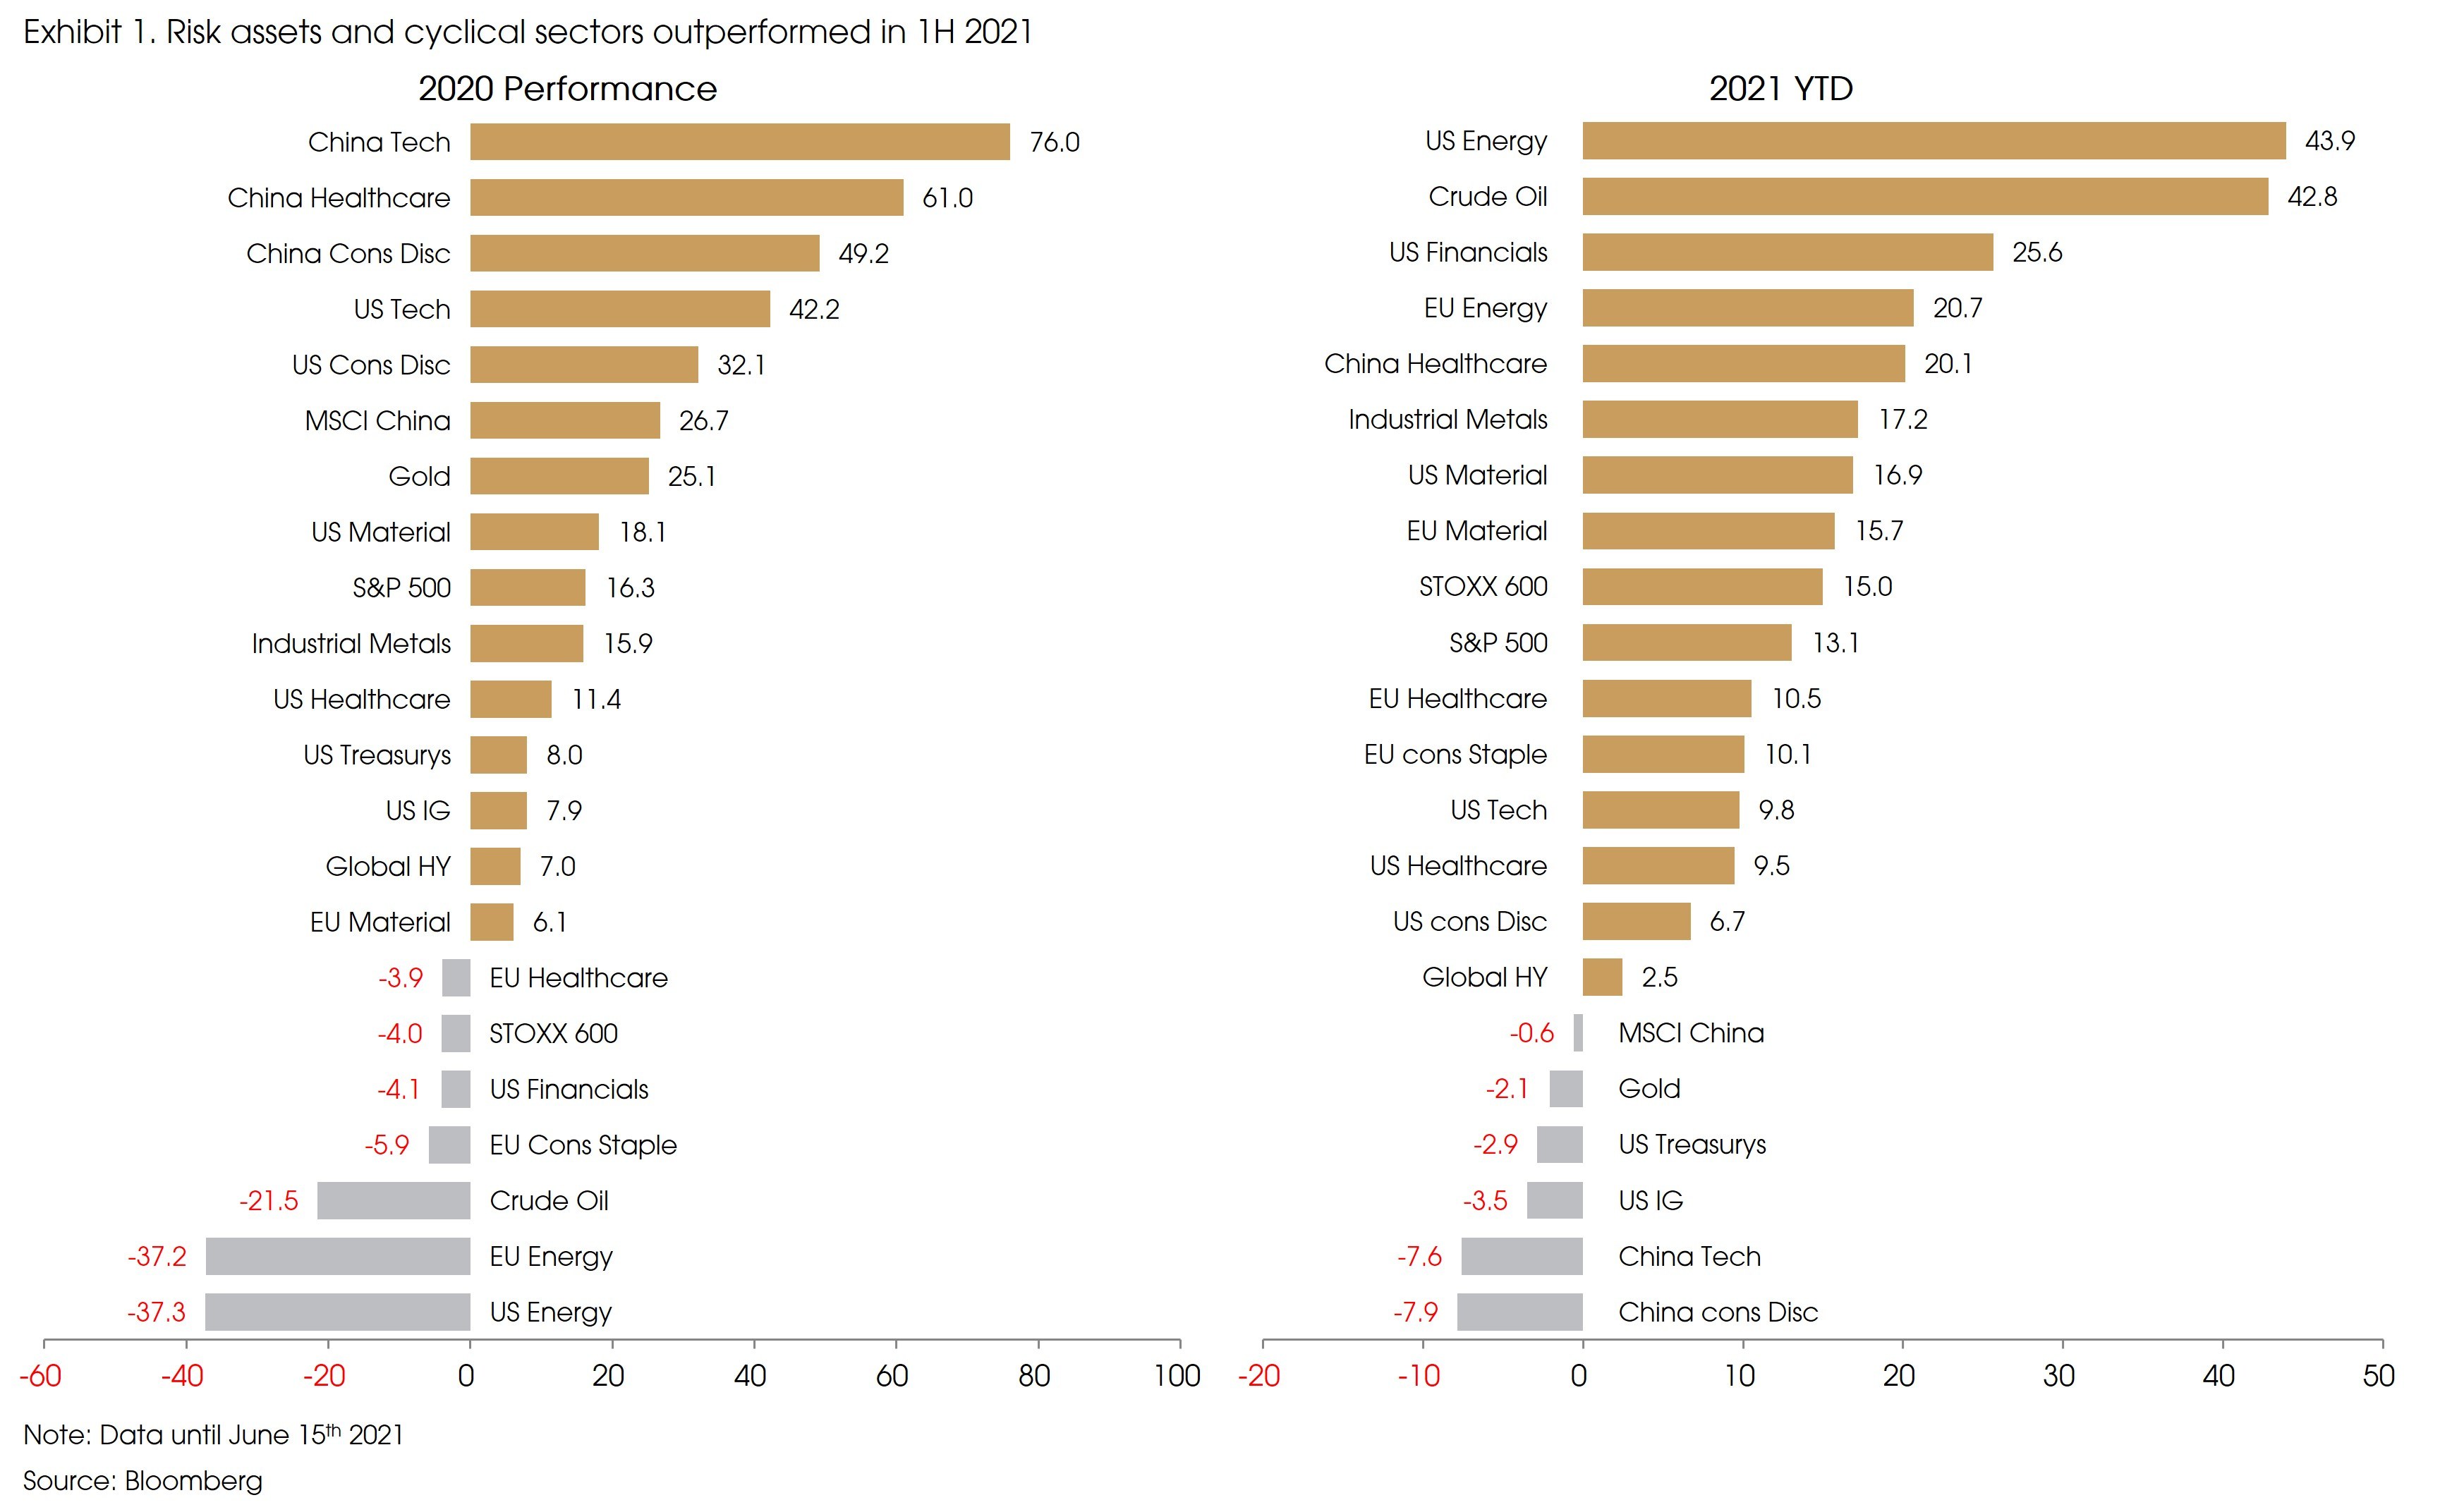
Such a solid economic recovery has led to the “reflation trade” or “recovery trade” in the market so far. Specifically, interest rates rose with the improving growth outlook. Risk assets outperformed in general, with sectors closely related to economic growth taking the lead. For example, energy sectors and oil prices recorded the largest increases from last year’s troughs (Exhibit 1). Other cyclical assets/sectors also performed well, such as industrial metals, the financial sector, and the material sector. Meanwhile, last year’s “pandemic winners”, i.e., tech, consumer discretionary, and the Chinese market underperformed within the equity universe. Safe assets, such as gold, investment grade bonds and government bonds were also under pressure due to the rising interest rates.
However, for the second half of this year, we see increasing headwinds for such cyclical outperformance, resulting from the peaking (and then probably weakening) growth momentum and the increasing policy uncertainties.
1. The recovery remains steady but with weakening momentum
The notable upward revisions in global growth were mainly due to the effectiveness and the fast rollout of vaccines in major economies in 1H 2021. As we have mentioned at the beginning of this year, reopening is the key to recovery due to the unique nature of this pandemic-led recession.
Moreover, the “Blue Wave” result from Georgia runoff and the quickly released and implemented fiscal stimulus also contributed to the better-than-expected growth in 1H 2021. However, with all the good news being relatively front-loaded within the first half, we expect to see moderating growth ahead.
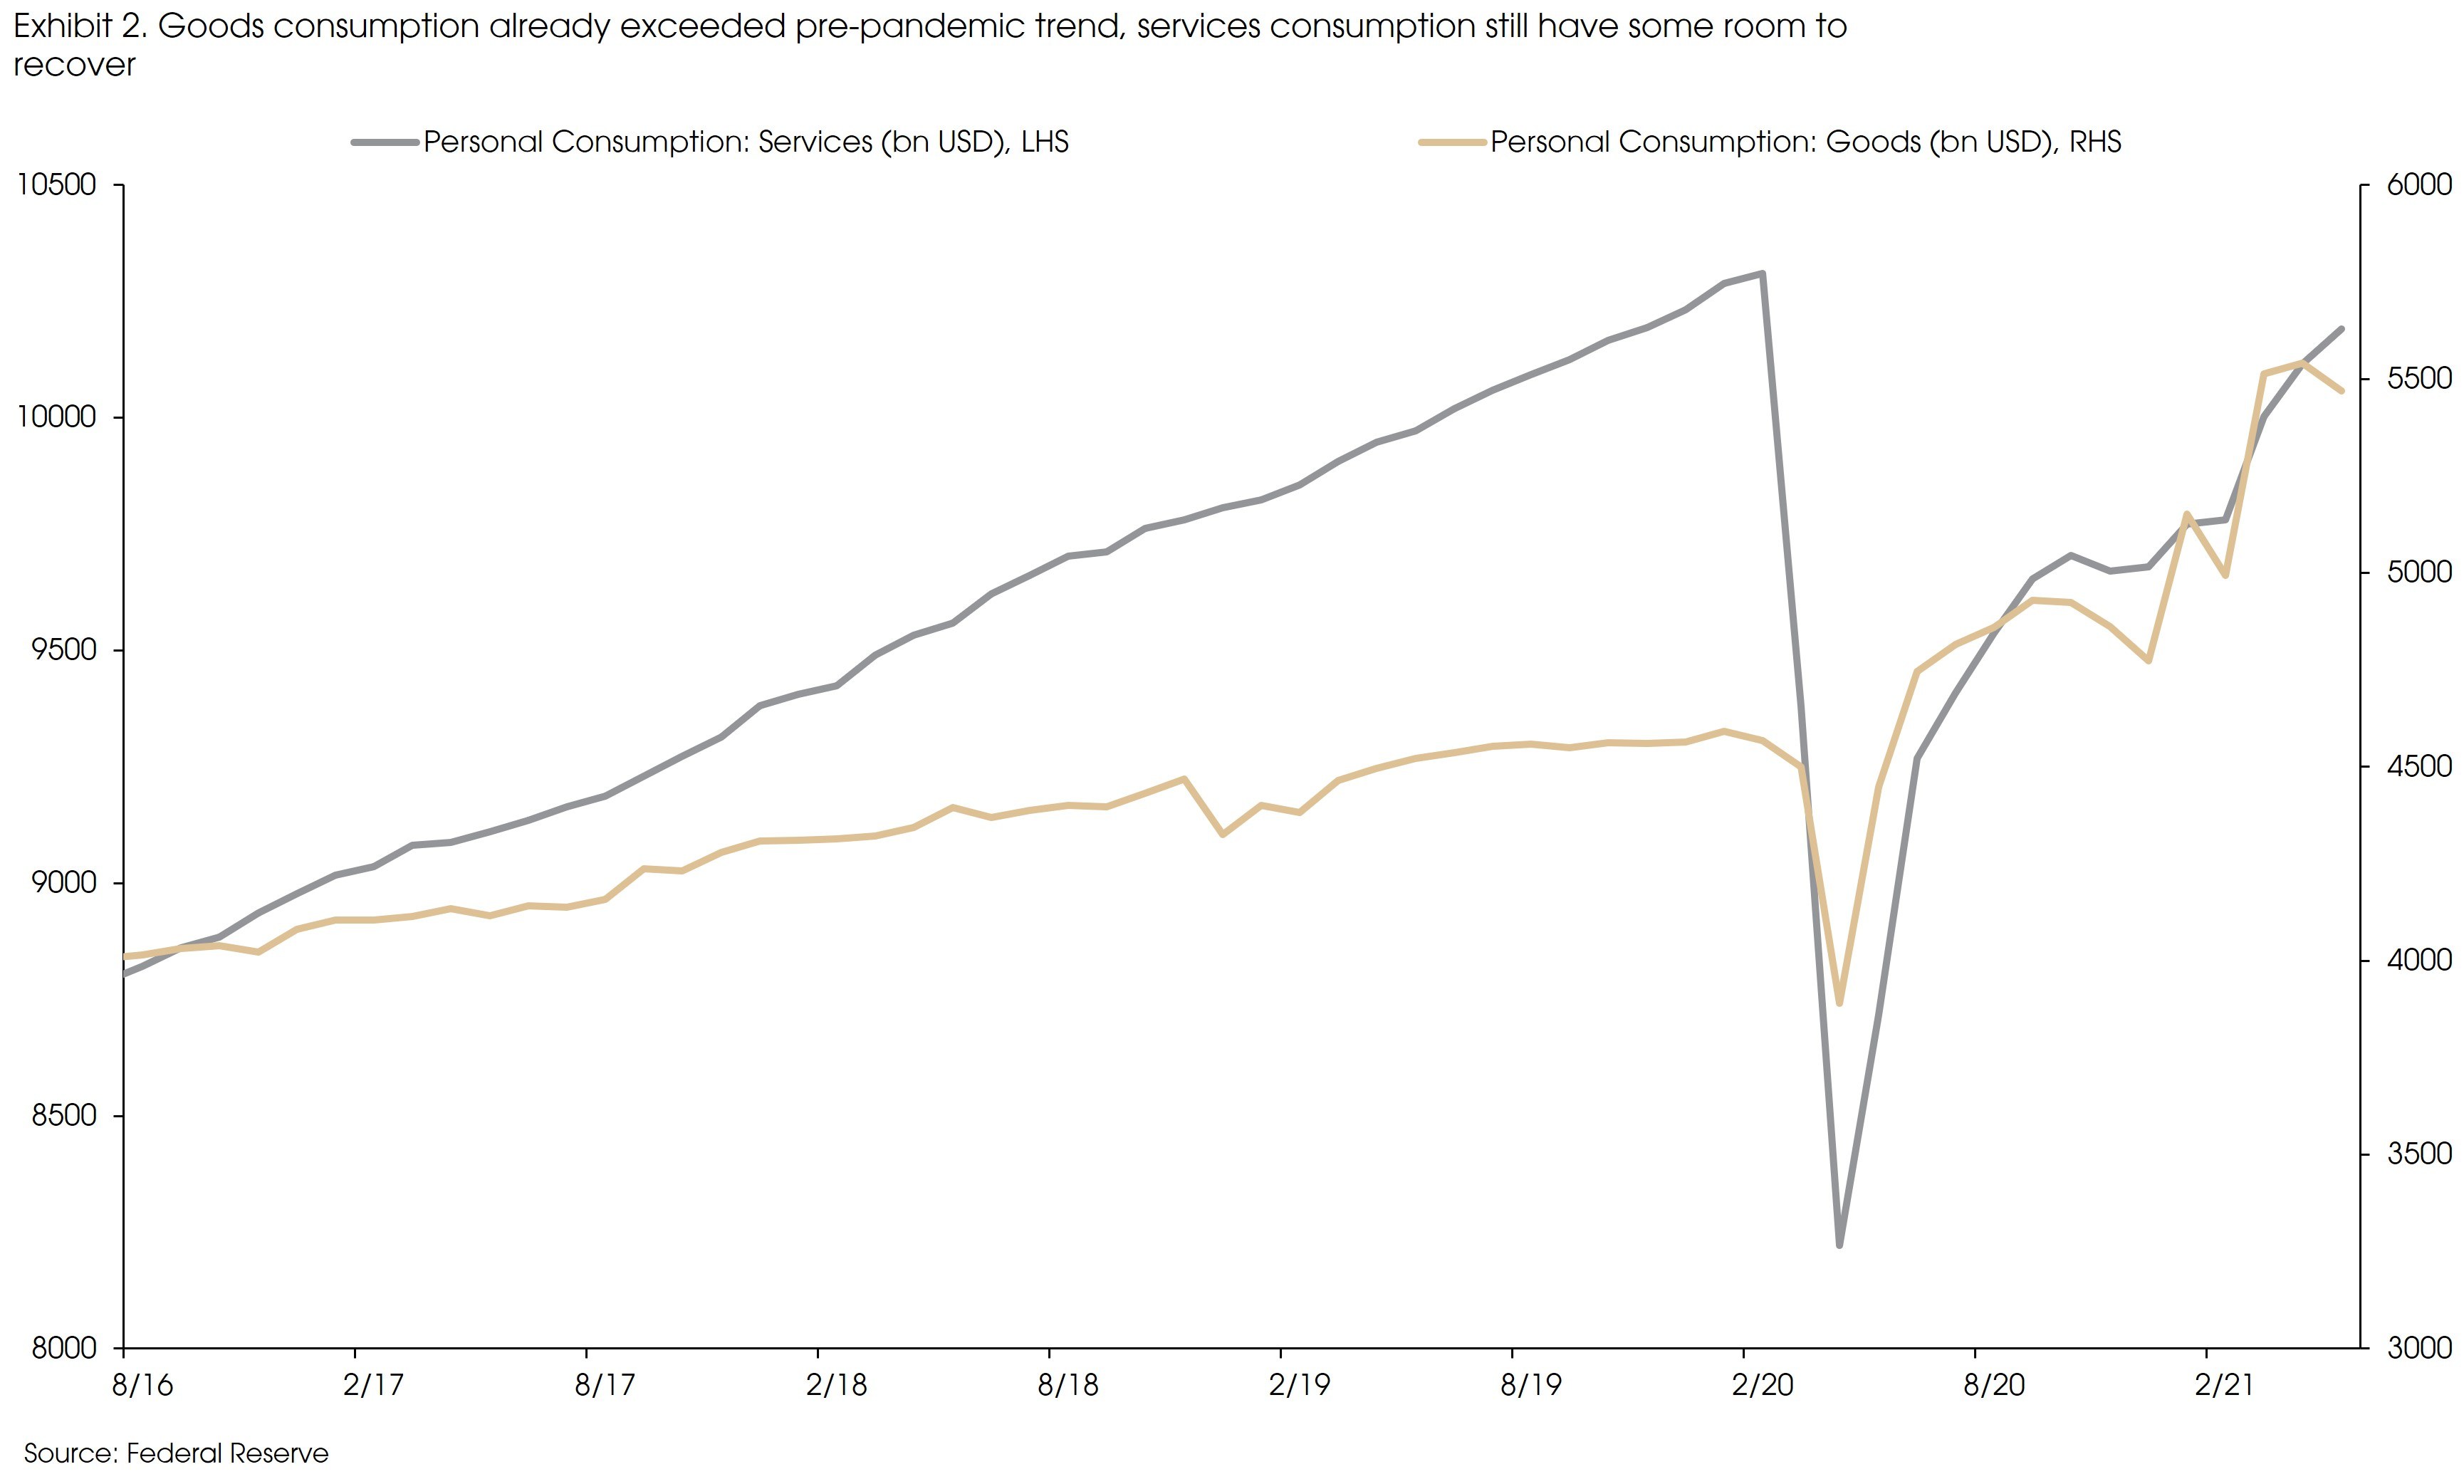
First, the large scales of fiscal stimulus in major economies, especially the generous payment transfer from governments to households, have resulted in strong recovery in goods consumption. For example, in the US, household consumption of goods has not only exceeded the pre-pandemic level, but also has reached well above the pre-pandemic trend (Exhibit 2). Considering the already above-trend goods consumption, and the expiring fiscal stimulus starting from 3Q, goods consumption is unlikely to be the driver for future growth.
Specifically, part of the strong consumption of goods was merely a “pandemic thing” due to the restrictive measures imposed among services sectors (e.g., traveling, dining, lodging, leisure, etc.). As the economy further reopens, the twist between goods and services consumption should gradually unwind.
Therefore, services consumption should become a key driver for the recovery going forward, and the expected herd immunity in major economies should be the main catalyst for this service sector recovery.
Secondly, the room for further supply-side recovery is also limited. Industrial capacity utilization rates in major economies have already reached close to or above the pre-pandemic levels. For example, Europe and China have both reached above the pre-pandemic utilization rates. The US capacity utilization rate increased from 63% in last April to 75% now, very close to the long-term trend of 79.6% (or the pre-pandemic high of 79.9%). Room for further increase in capacity utilization still exists, but the change should be relatively limited compared with the improvement during the past year.
Supply-side shortages will gradually ease as capacity utilization rates further recover. However, for some sectors, the already above-trend capacity utilization rates with the still below-trend stock levels suggest that supply-side shortage is likely to continue within these sectors for the near term.
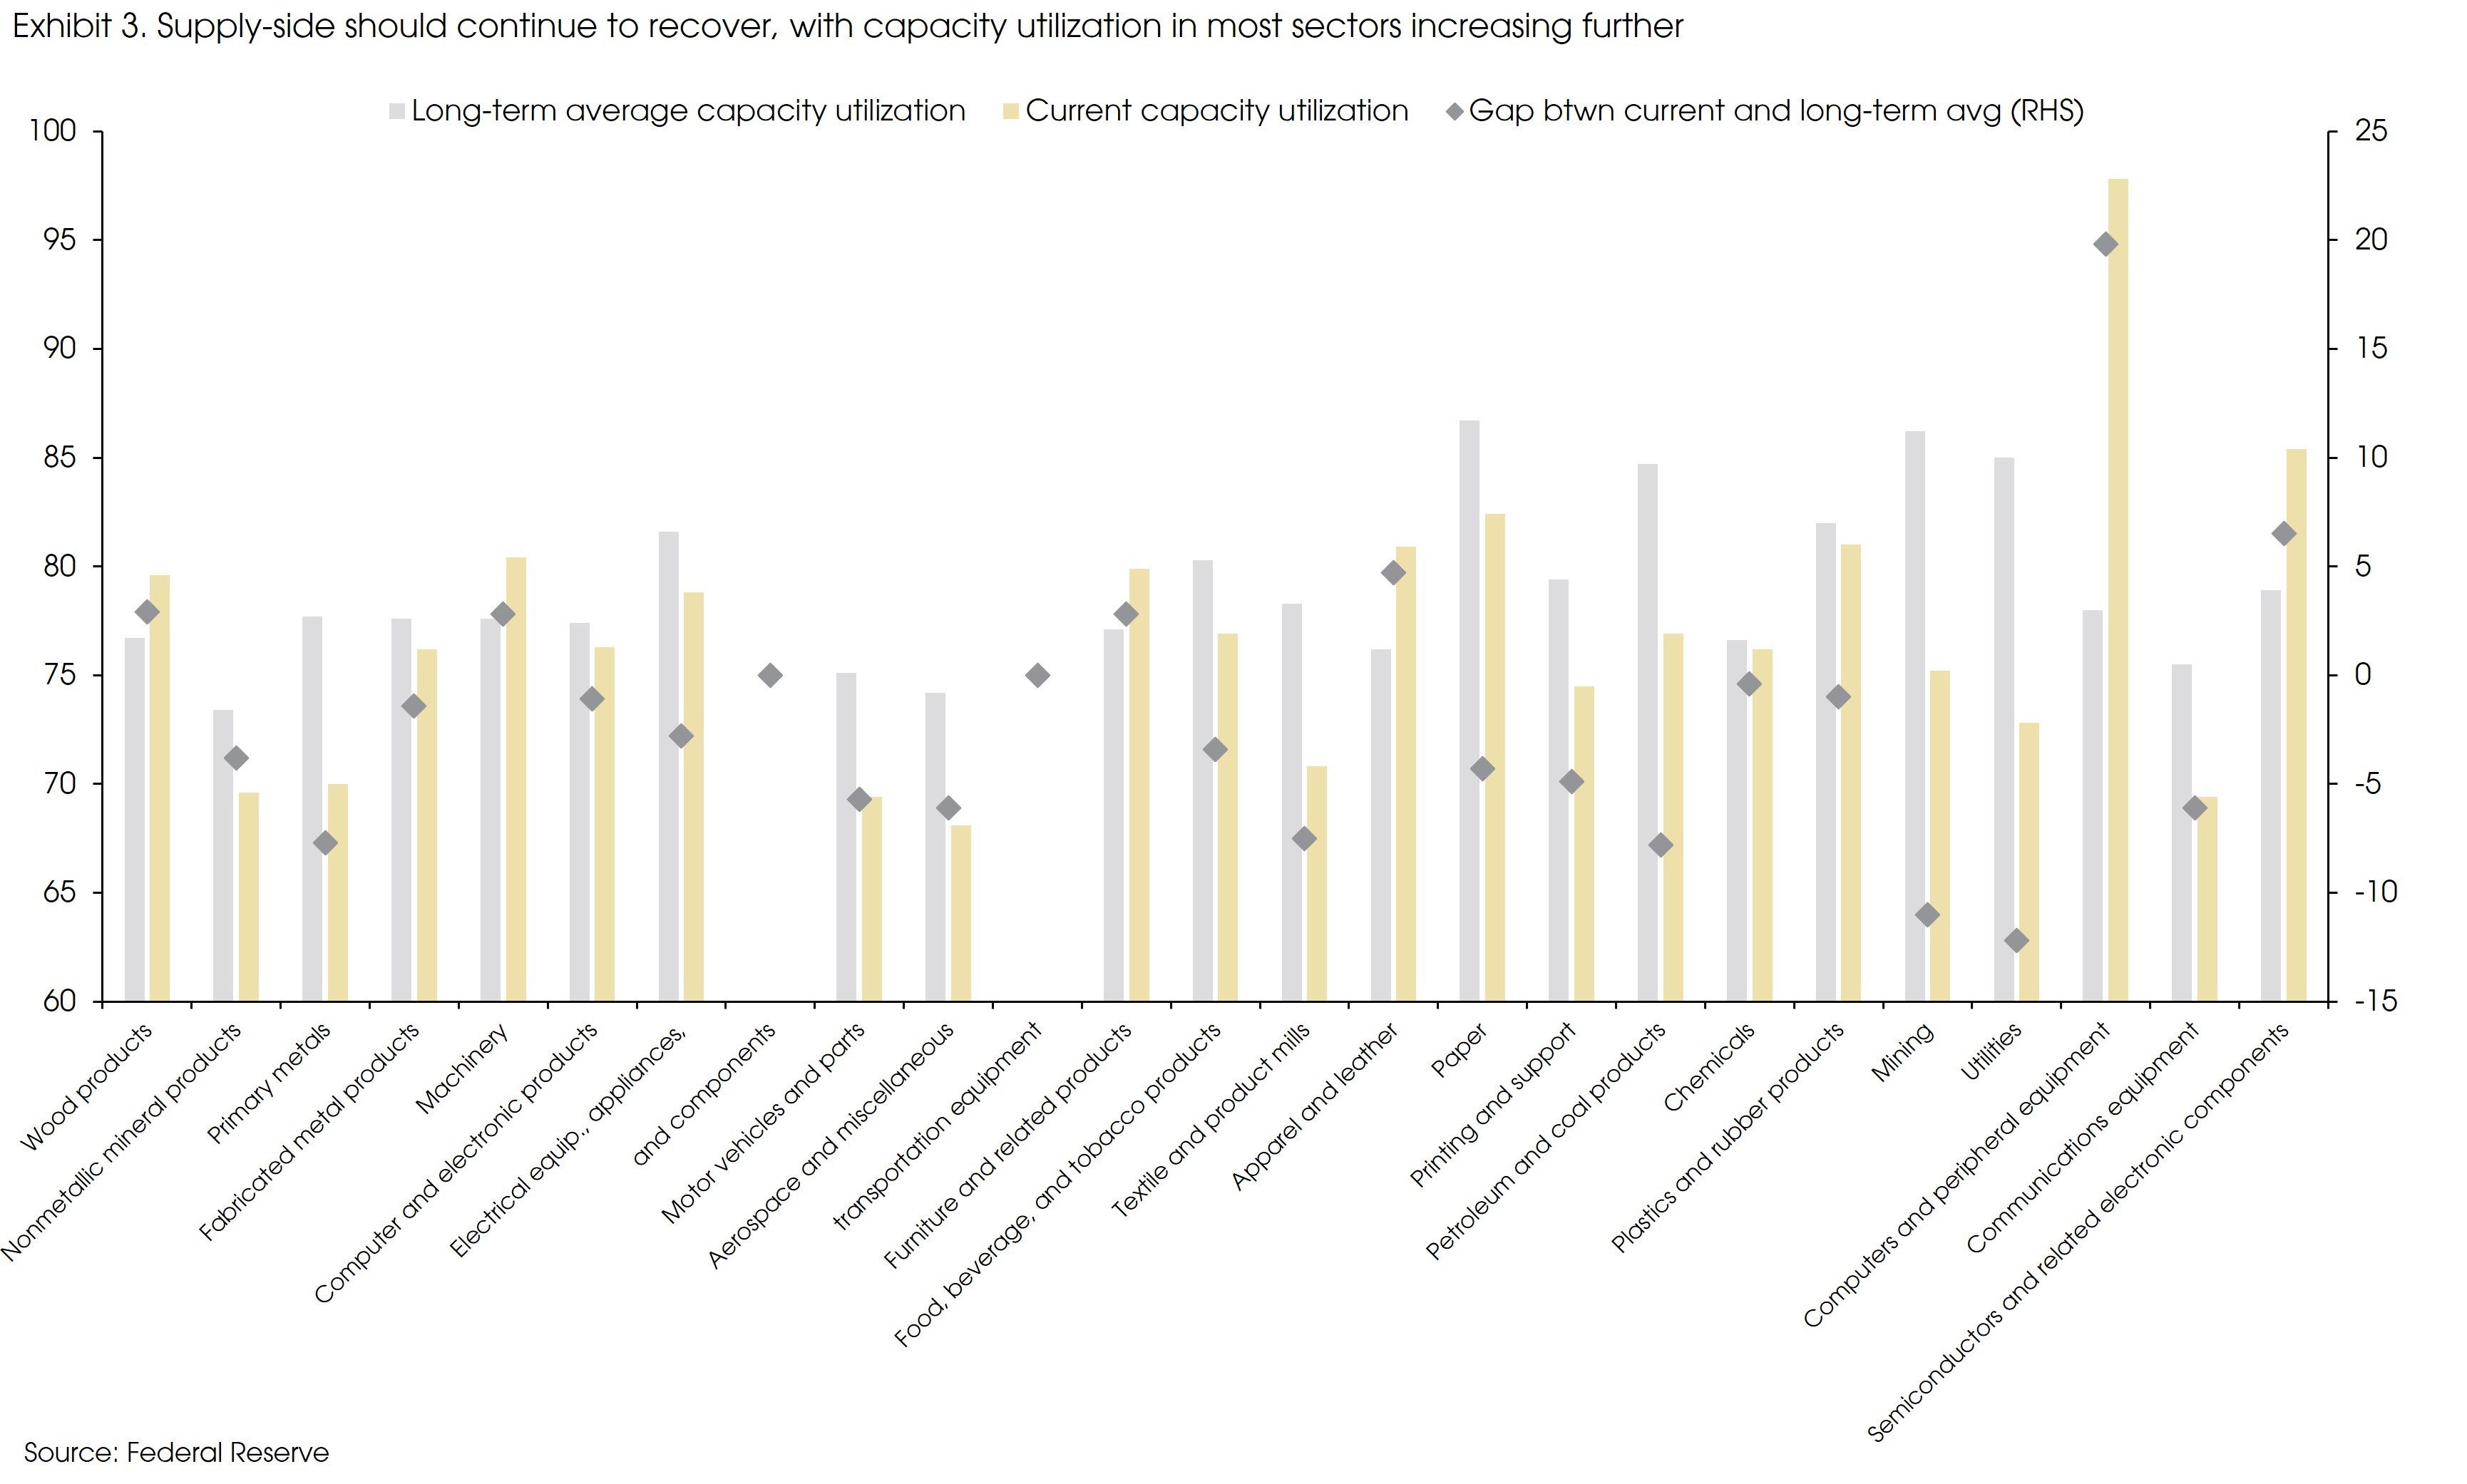
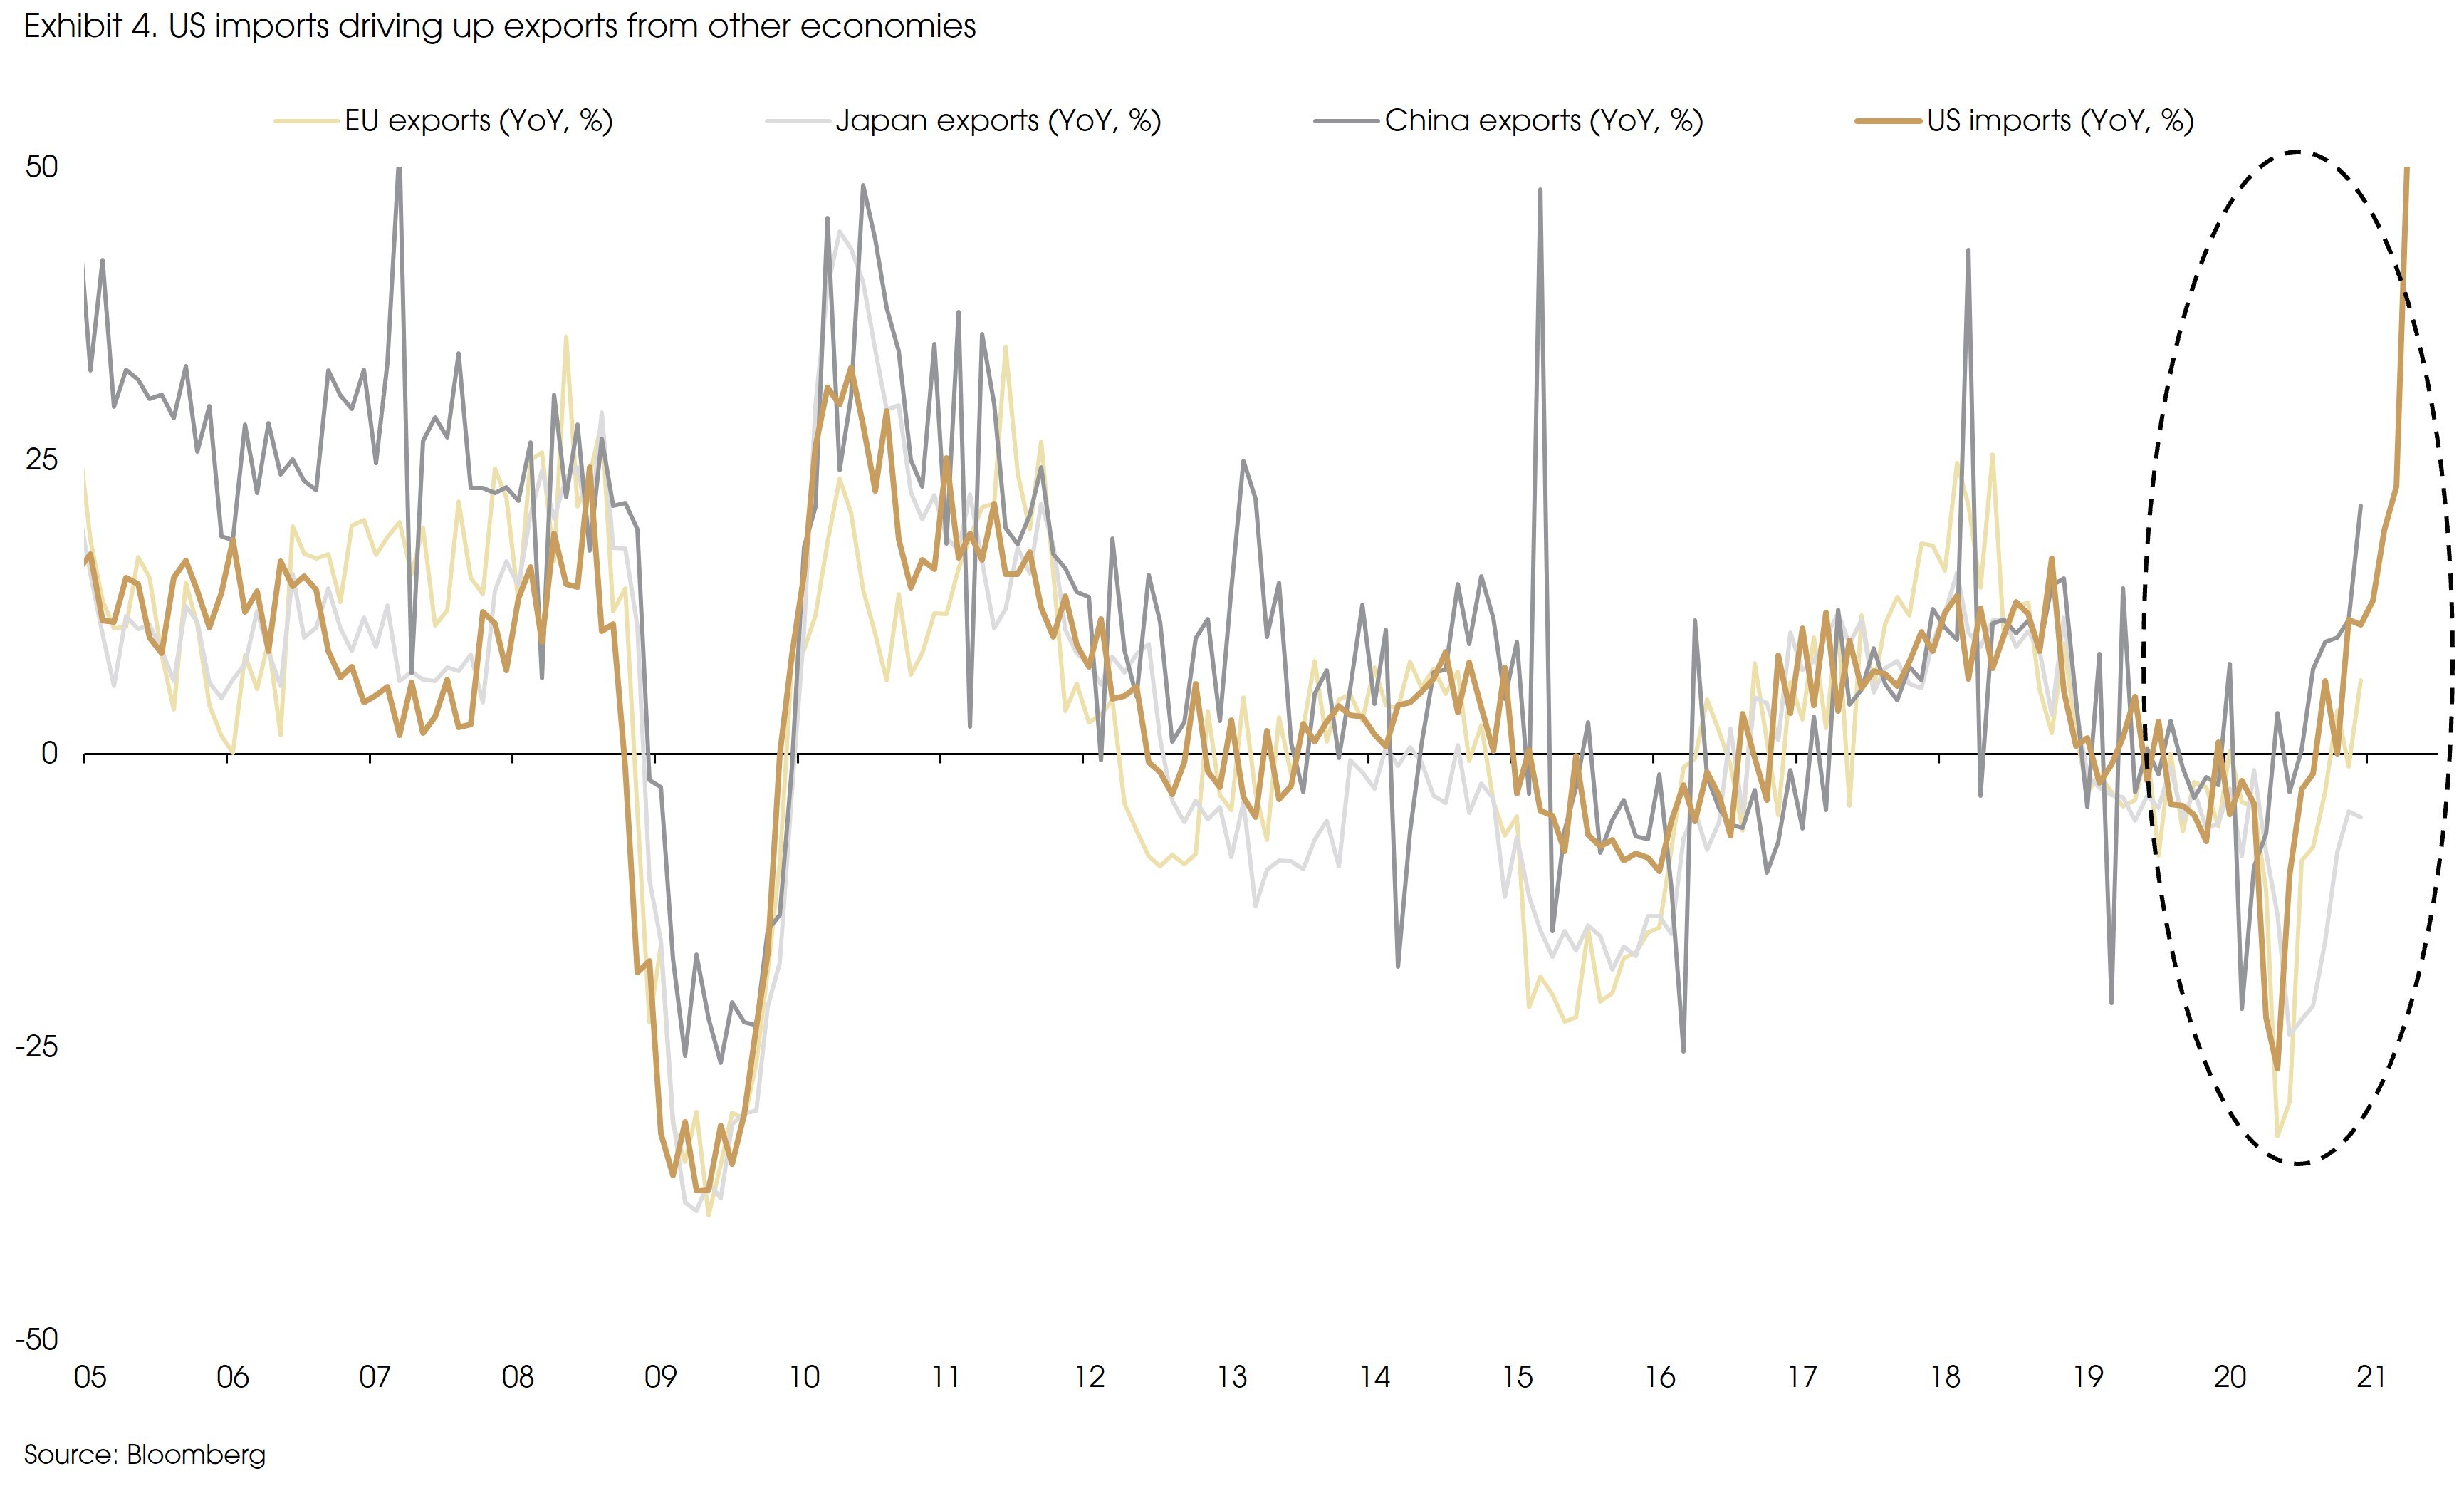
For example, the US may continue to face supply shortages in wood products, machinery, furniture, apparel, and semiconductor related products (Exhibit 3). Such supply shortages should continue to drive up imports for centain goods from other countries, such as Europe (for machinery equipment), Canada (for wood products), and China (for furniture, apparel, and electronics). For the past year, the large scale of fiscal stimulus and the supply shortages in the US have been driving up export growths in its major trade partners, i.e., China, Europe, and Japan (Exhibit 4).
However, going forward, as supply shortages continue to ease in most sectors, and with the fading low-base effect, export growths in China, Europe, and Japan should decline.
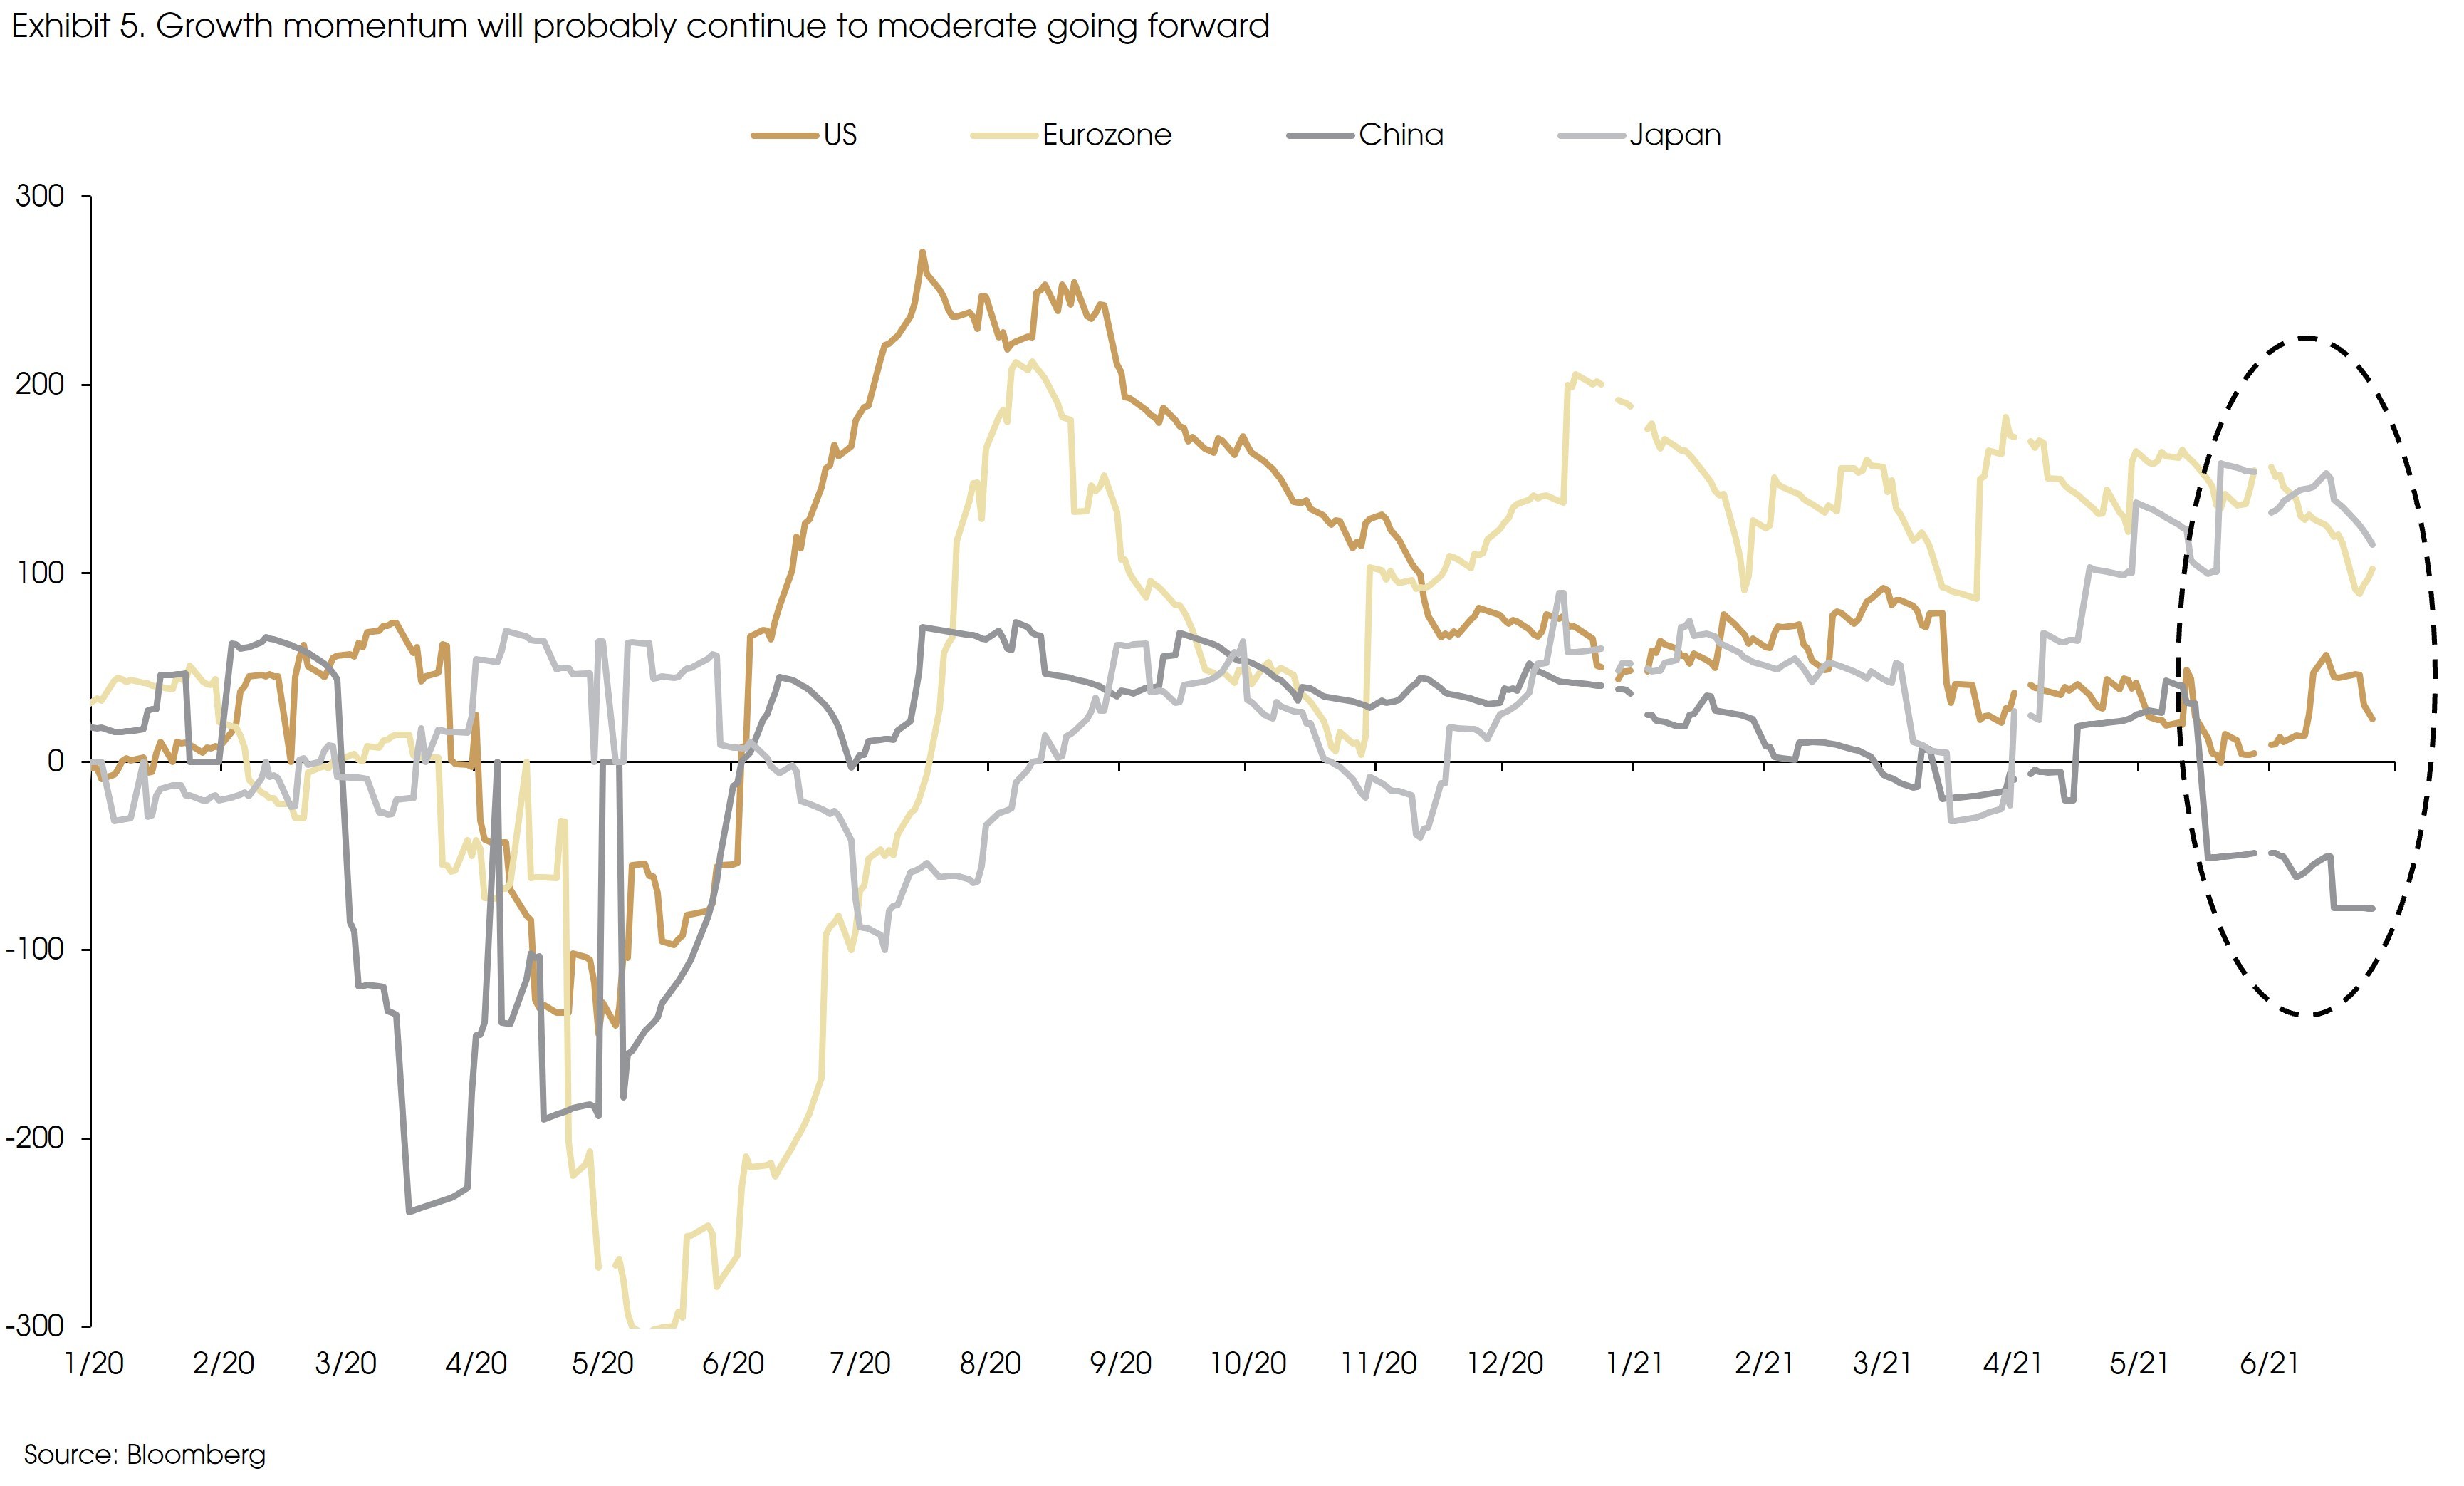
Therefore, looking forward, as capacity utilization rates reaching previous highs, goods consumption already exceeding pre-pandemic levels, and export growth weakening, recovery in major economies will rely on a narrowed range of activities, mainly, the recovery of the pandemic-hit services consumption. This suggests moderated growth going forward (Exhibit 5).
The recovery will continue to be uneven among different regions. Due to the better control of the pandemic, China has already reached the pre-pandemic growth trend, closely followed by the US. Meanwhile, Euorope and Japan are lagging behind, but are likely to play “catch-up”, especially Euorpe (given European countries’ significantly accelerated vaccine rollout). Economic recovery in other emerging markets (ex-China) will mainly depend on the pandemic and vaccination conditions.
Given such a growth outlook, we expect to see different policy directions from major central banks. The Chinese central bank has already started to normalize its monetary policy, suggested by the declining credit growth. The Fed also sent some hawkish signals recently, resulting in market expectations on an earlier rate hike. However, the European Central Bank (ECB) and Band of Japan (BoJ) still have further to ran, in terms of policy normalization.
Therefore, we are now really facing the quesion that we have been thinking and talking about since last year: when will the central banks, especially the Fed, start to withdraw the ultra-loose policy, and what will happen?
The first question is relatively easier to answer. Based on the QE tapering in 2013, the key factor that determines the timing of the taper is the job market condition. However, the Fed would not wait until a full recovery in the job market, achieving around 65% of the pre-crisis payroll level should be enough to take action. Therefore, we expect to see tapering start in 4Q.
2. What do we know about the QE taper tantrum?
To answer the second question of what will happen once the Fed signals to reduce the QE purchases, we did a simple calculation.
The market is afraid of the word “taper” mainly due to the bad memories back in 2013.
In his testimony to Congress in May 2013, the then-Fed Chairman Ben Bernanke mentioned a possible step-down in the pace of QE purchases given then improving economic conditions. However, the market was not expecting any tightening turns from the central bank, not even the very mild ones. Such a surprise led to significantly rising volatility in the market, and has been referred as the “QE taper tantrum” ever since.
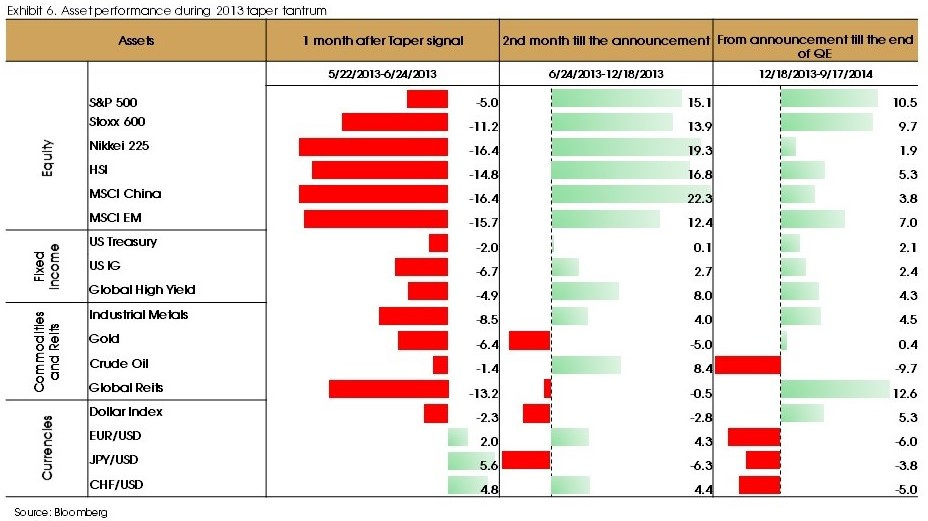
We calculated the asset performance from the tapering signal (May 22nd, 2013) to the official announcement of QE tapering (Dec 18th, 2013), and from the official announcement until the end of QE (Oct 29th 2014) (Exhibit 6).
Almost all assets fell during the month after the tapering signal. However, the US equity fell the least compared with other major markets. Japan, China, and the general emerging markets were badly hurt. That said, the market turmoil only lasted for about one month. After that, and until the official announcement of the QE tapering in December 2013 (which did not generate significant volatility in the market), most assets rebounded, with equities significantly outperforming other assets. Most markets reclaimed their losing ground during the period, except the MSCI emerging market index, as the expected liquidity tightening from the Fed led to significant capital outflows from emerging markets.
Bonds underperformed, compared with equities, due to the rising interest rates after the tapering signal. However, most assets reclaimed the loss within 14 months, except gold. Gold was badly hit not only by rising nominal yields, but also the real yields.
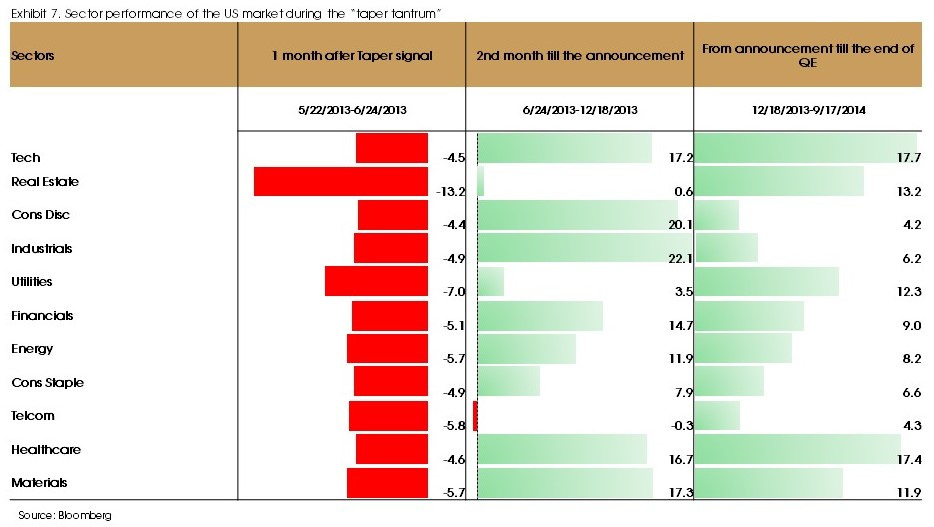
For different sectors in the US market, all sectors fell during the first month after the signal, and started to rebound afterward (Exhibit 7). Tech and healthcare outperformed other sectors, by rising around 30% throughout the entire period (from tapering signal until the end of QE).
3. Updated views on assets for 2H 2021
Based on the above data and analysis, we update our views on different assets for the second half of the year:
- The US 10-year yield may increase towards 1.8%-1.9% (the pre-pandemic level) until the official announcement of QE tapering. Seen from the 2013 experience, interest rates increased after the tapering signal until the official announcement. Therefore, there are still upward pressures in interest rates. However, we maintain our view that higher inflation should be transitory. Thus, the rising nominal yields should be mainly driven by increases in real yields.
- We remain pro-risk, even considering the potential QE tapering. Although growth momentum may moderate after the quick rebound during the past year, global recovery should continue, benefiting risk assets in general. QE tapering could lead to increased volatility, or even market downturn, but it should be short-lived, mainly affecting sentiment.
- Bond and gold may come under pressure, due to the potentially rising interest rates.
- Yield curve may continue to flatten, benefiting long-duration assets. Not only long-term, but also short-term yields may increase, due to the tightened liquidity condition. This will benefit long-duration assets, i.e., growth stocks.
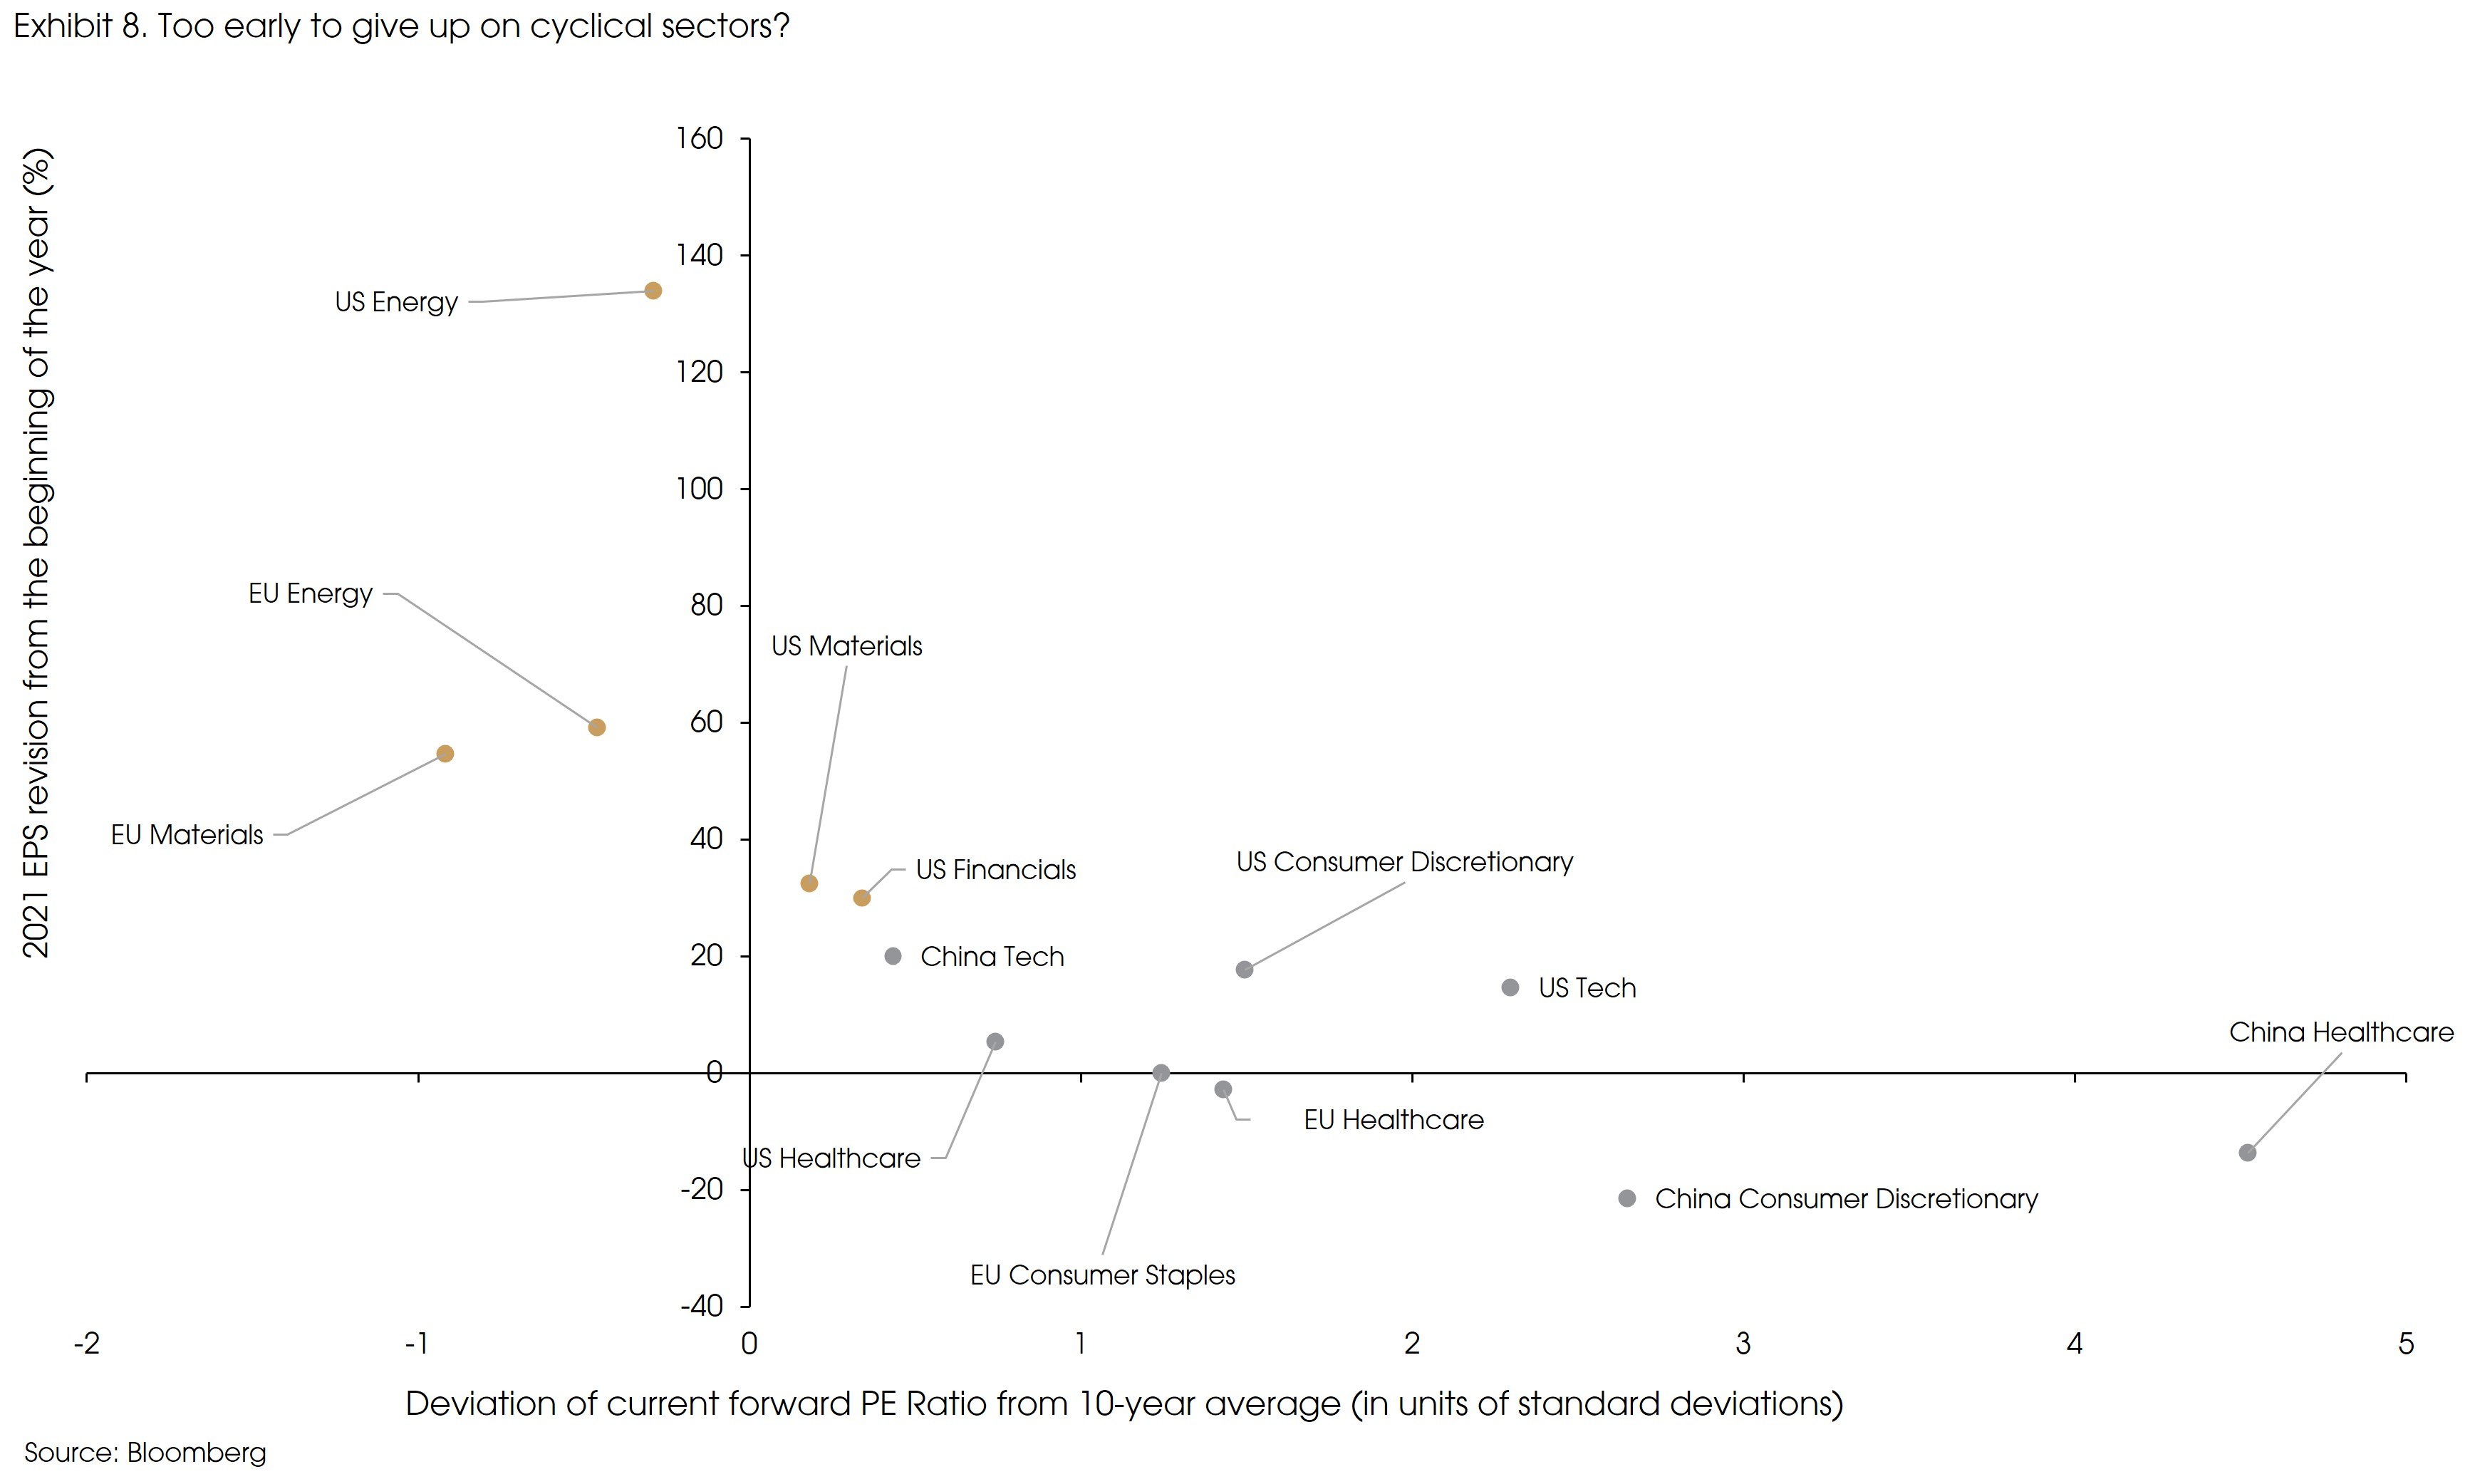
- The moderating growth momentum and the tightening liquidity condition suggest fading tailwinds for cyclical names. (Exhibit 8) However, cyclical sectors are still relatively cheaper than growth names, with strong earnings growth and earnings outlook (across different markets). Therefore, it is still too early to give up on cyclical names.
- We recommend pro-risk allocation with balanced holdings on growth and cyclical names.
Sources: Federal Reserve, IMF, Morgan Stanley, JP Morgan


