CIO Viewpoint: Rising Interest Rates - Should we be worried?

The recent surge of the US 10-year treasury yield sent many stocks with quite impressive returns last year into "bear territory" (more than 20% drawdown), led to a bond selloff, and triggered significant concerns about asset bubbles, especially the ones with high valuations.
We try to answer three questions here: 1) Will the interest rate continue to go up? If so, how high can it go? 2) How to hedge against a rising interest rate? 3) What to focus on in the longer-term?
How high can the US 10-year yield go?
For the past 40 years, global interest rates generally followed a downward trend. The most-watched 10-year US treasury yield kept trending down from 15% in the early 1980s to under 10% in the 1990s, fell under 6% after the 2000 tech-bubble-led recession, then went down further, anchoring below 4% in the post-2008 period (Exhibit 1).
Moreover, after each recession in the past 40 years, the 10-year US treasury yield never reached the pre-recession levels (not to say the pre-recession highs). This observation holds during the Fed's rate hike cycles or the QE (Quantitative Easing) tapering period from 2017 to 2019.
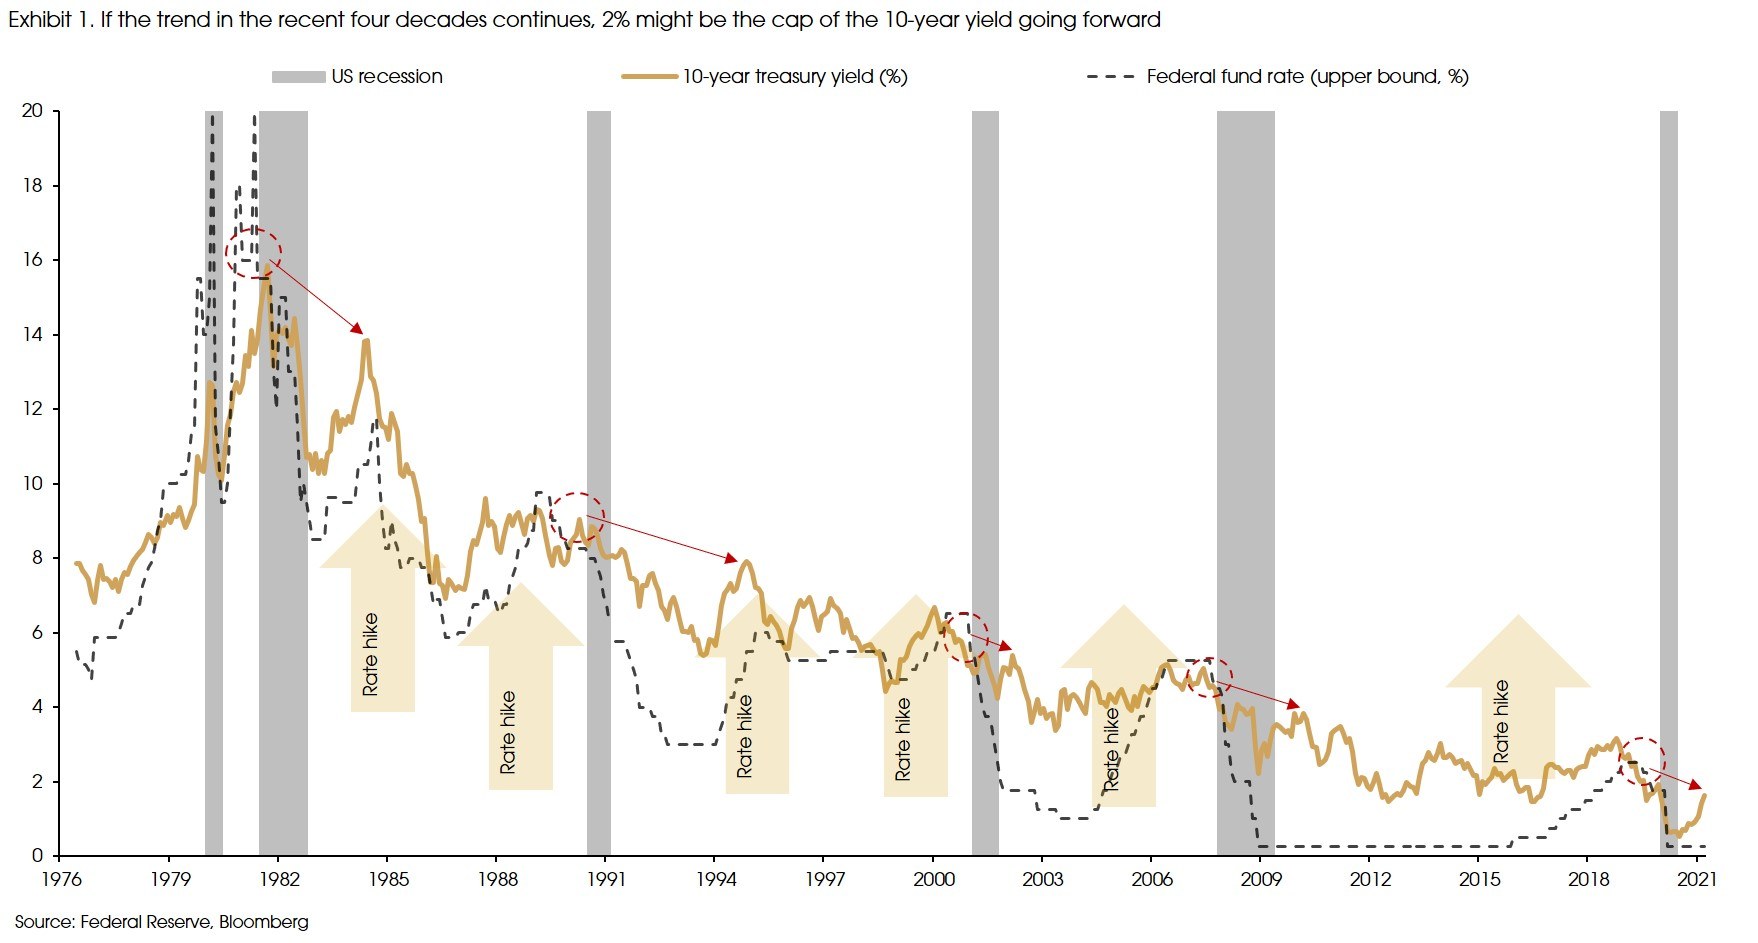
If history is any guide, we should not worry too much about the current rising interest rate. The 10-year US treasury yield should be well capped at 2% (the pre-recession level was 1.9% at the end of 2019), regardless of policy changes from the central bank, no matter QE tapering or rate hike.
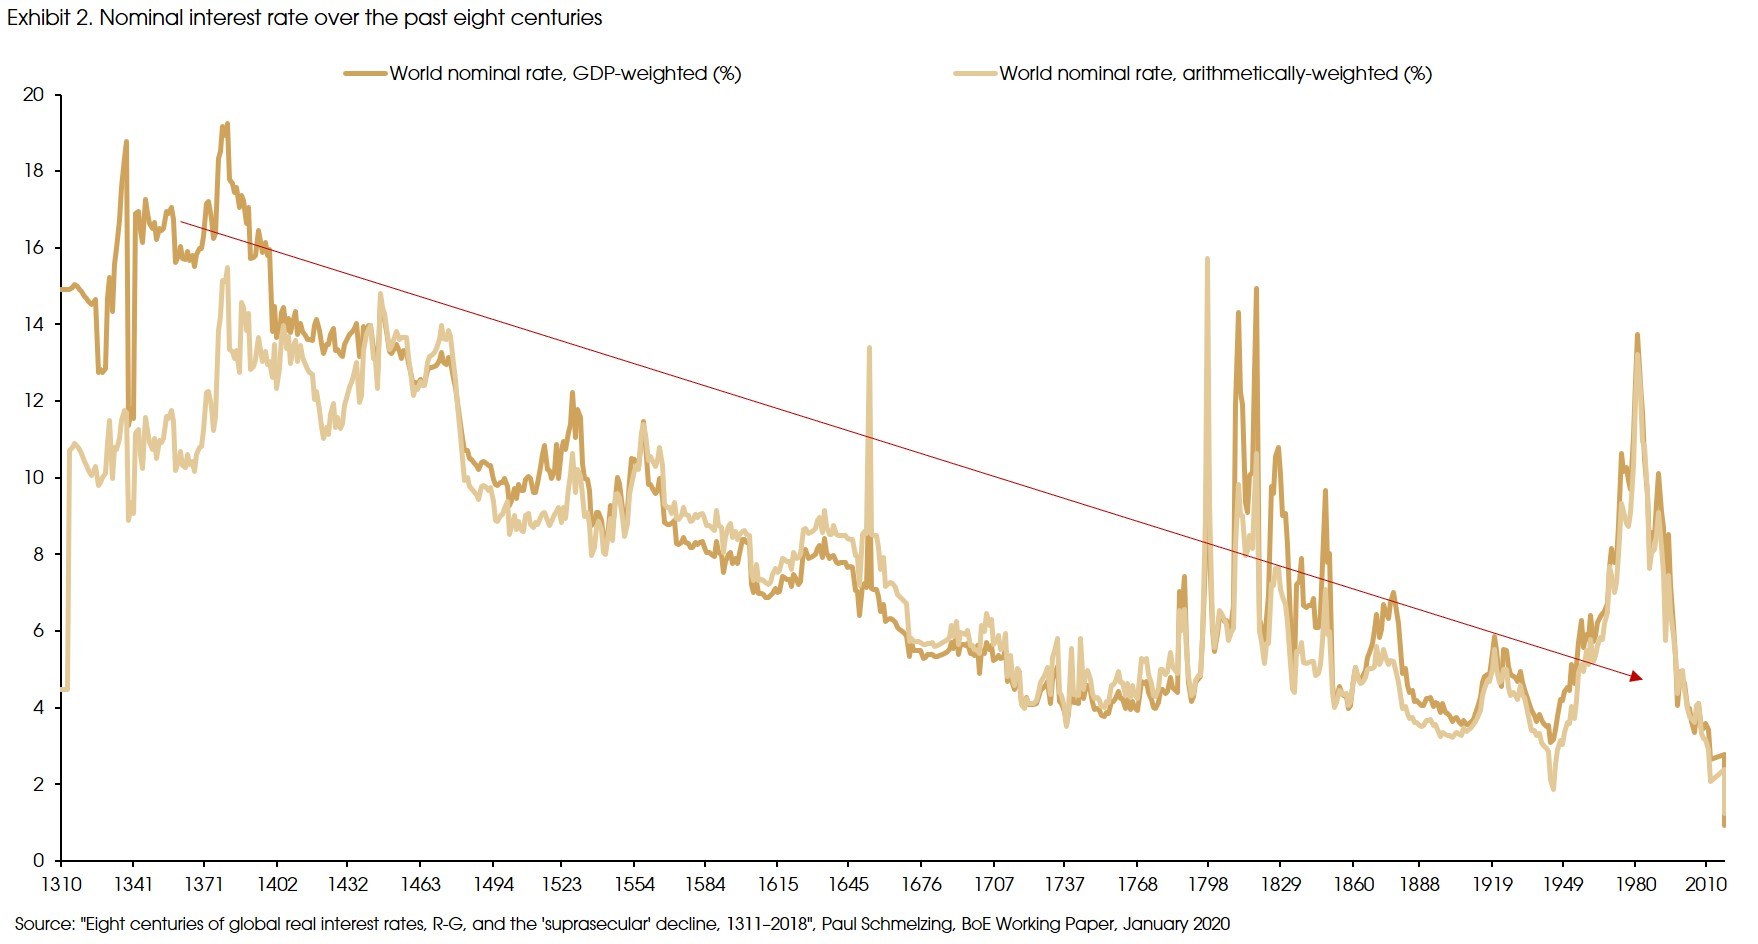
Indeed, there is a big "if," and historical trends do not always repeat themselves. Before 1980, there was a 35-year-period with rising interest rates. That said, if we look at a more extended period of the interest rate's history, it seems like rising interest rates are only "cyclical" (Exhibit 2).
To take a more detailed look at the past few centuries, we see several factors that may contribute to the rising trends of interest rate: 1) industrial revolutions: the application of new technologies may lead to large scales of build-ups in new capacity, significantly increasing demand for capital investment and enhancing productivity (e.g., the 1774-1820 period); 2) rising population growths: the post-war periods usually lead to rising birth rates and population growths, driving up labor supply and consumption demand (e.g., the post-Civil War period from 1890 to 1910 in the US, and the post-WWII period); 3) hyper-inflation: expansionary policy, overheated economy, and price shocks may lead to hyper-inflation, thereby, aggressive rate hikes from central banks, driving up interest rates (e.g., the 1970-period in the US).
However, during the past 40 years, we had a declining population growth (world population growth decreased from 2.1% in 1971 to 1% in 2019) and a rising income/wealth inequality, which depressed labor productivity and consumption demand. Moreover, the lack of impactful technology breakthroughs also led to weakening growth in capital investment. The information technology revolution in the 1990s improved economic efficiency and living standards. However, its impact on traditional industries (e.g., mining, construction, auto) was relatively slow and limited, failing to drive-up capital investment or significantly increase the entire economy's productivity.
As a result, total demand has been insufficient, resulting in low interest rates, low inflation, and low growths in recent decades.
Will this downward trend in interest rate be reversed going forward? We are not very convinced: the decrease in population growth is unlikely to be changed, and we do not expect to see hyperinflation even with the unprecedented fiscal and monetary stimulus (which we will discuss in the second part). The only possibility lies with technological advancement. The ongoing digitalization and green transition may lead to increases in new infrastructure investment (e.g., the 5G network, data centers, expanding capacity in renewable energy production and storage productivity) and enhanced productivity. However, whether these new infrastructures can achieve impactful scales still merits further attention.
The debating inflation: Trending much higher?
The unprecedented fiscal and monetary policies have caused significant concerns about much higher inflation going forward. According to The New York Times, former US Treasury Secretary, Lawrence Summers recently referred to Biden's USD 1.9 trillion fiscal package as "least responsible" fiscal policy in 40 years. He warned that such policy has a 30% chance of causing higher inflation, leading to rate hikes, and pushing the economy towards a recession.
However, disputing views are both from the Fed officials and economists such as Paul Krugman and Jason Furman, addressing the remaining 9.5 million job losses in the economy and the diminishing effect of the government's pandemic relief spending over time.
In our view, inflation will rise in the near-term due to the low-base effect from last year (near or sub-zero CPI levels among major economies in the first half of 2020), the quick rebound of demand (given the policy support), and the ongoing supply shocks in some sectors (e.g., mining and crude oil). That said, it is hard to justify a continuous increase in inflation.
First, from the policy side, one simple observation is that: if the massive fiscal and monetary stimulus can easily lead to high inflation, then Japan might be having some hyperinflation by now.
Moreover, compared with Trump's tax cut (which was meant to be permanent), Biden's pandemic-relief plan is a one-time income transfer. Trump's tax cut failed to significantly drive up the growth of capital expenditure (but led to more stock buybacks), only lifting the US GDP growth for one year. The US economic growth started to slow down in 2019, before the pandemic. In that sense, Biden's one-time relief plan should have a more limited long-term effect on closing the output gap.
However, the ongoing de-carbonization revolution or green transition may make a difference. According to Goldman Sachs, unlike most recent technological advancements or industrial reforms (e.g., digital revolution), the green transition requires significant increases in capital investment (around 1.5 to 3 times more capital-and-jobs-intensive than traditional energy infrastructures). In this vein, Biden's proposed USD 2-3 trillion infrastructure investment plan would be much more impactful in creating excess demand and inflation than the relief package. However, the investment bill will probably be featured with a tax hike and is far from a done deal, at least for now.
Some market view expects the pent-up demand to drive up inflation. We expect to see a further rebound in demand as we get herd immunity. However, there is also considerable pent-up supply; for example, the service sector was shut down for a year.
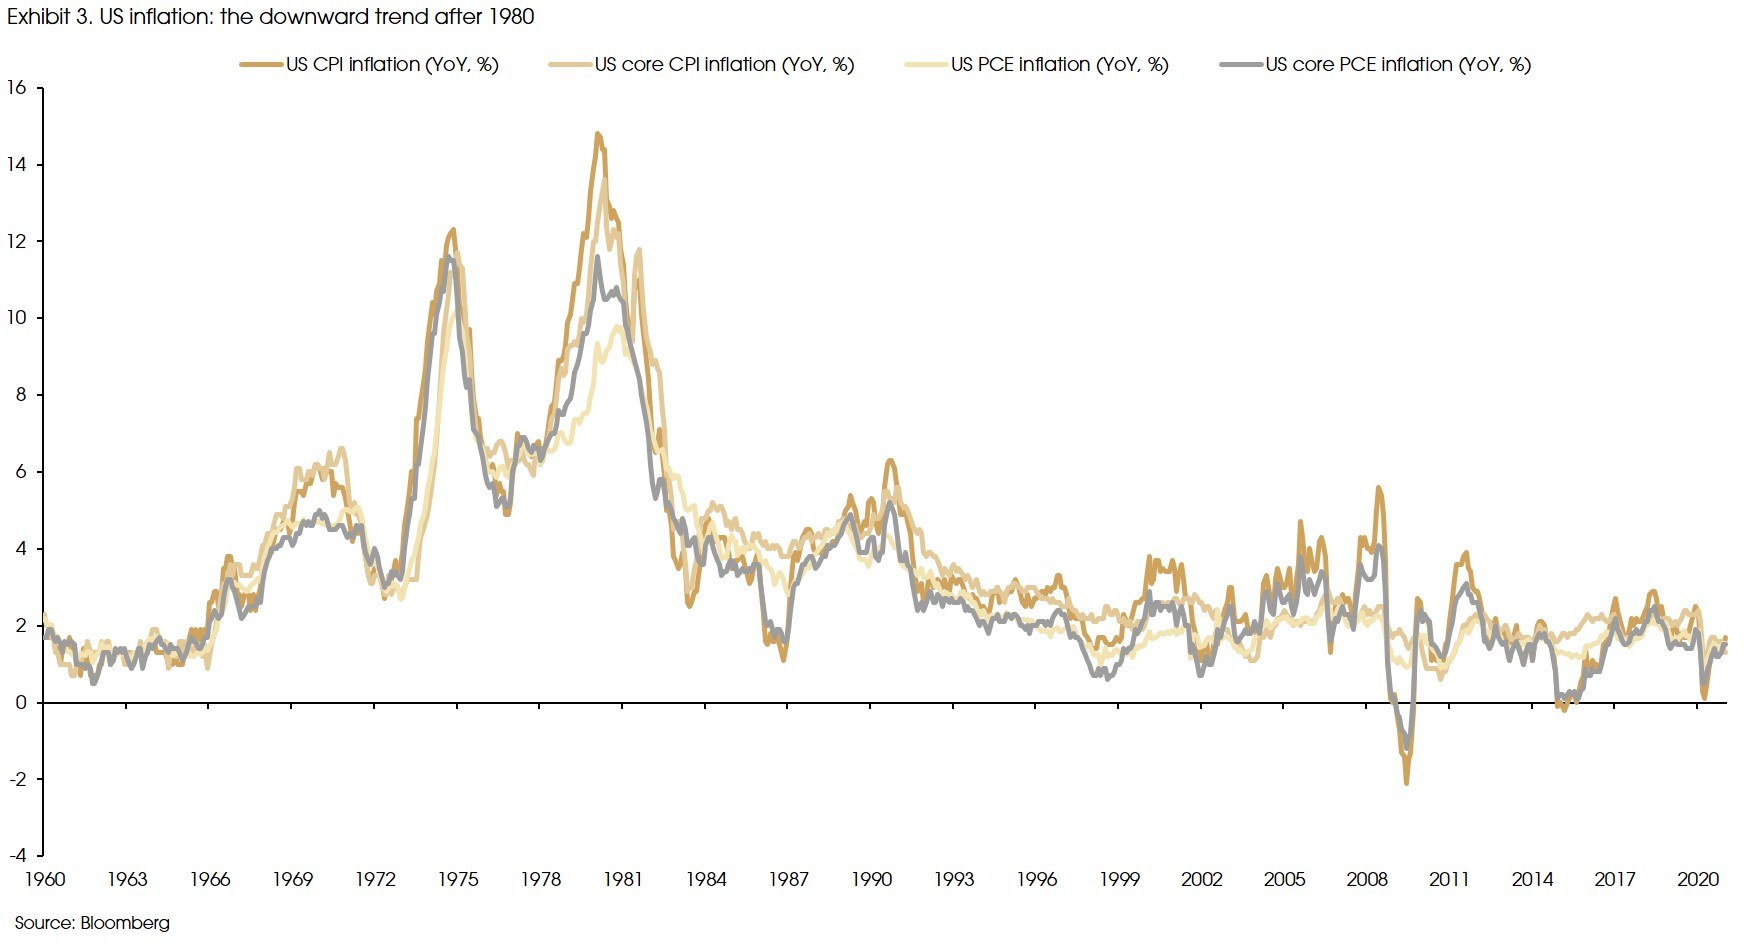
Finally, on commodity prices, there are price shocks in the commodity universe. However, commodity prices are determined by global commodity demand and supply and the US dollar, which is a different dynamic compared with the aggregate demand/supply dynamic that determines the general price levels. One observation is that the US inflation stayed steady in 2000s, despite a dramatic rise in commodity prices (Exhibit 3).
Therefore, the current driver forces for rising inflation should mainly be short-term ones, and unlikely to be secular to cause an early/aggressive monetary tightening from the Fed.
In that sense, we believe that the interest rate should generally follow the overall historical trend observed in the past 40 years. That said, we do not rule out the possibility of overshoots in either inflation or interest rates, but any overshoot should be followed by quick fallbacks.
We might be wrong that the current changes may cause a turnaround of the inflation and yield trend. However, based on the current information that we can get, the bottom line is that we do not see the rising trend of inflation and interest rate as a strong case.
How to hedge against a rising interest rate?
Given the ultra-low levels of interest rate last year and the expected quick rebound in economic activities this year, even without a turnaround of the long-term trend, short-term surges and even overshoots in interest rates are still possible.
Although the surge in the US 10-year treasury yield has moderated recently compared with the previous two months, future quick rises are still likely. For example, higher inflation data are expected in the second quarter, given last year's low base. Moreover, major economies, especially the US, may achieve herd immunity, and the infrastructure bill might be rolled out in the second half of this year. Meanwhile, the Fed may start to discuss QE tapering in the last quarter.
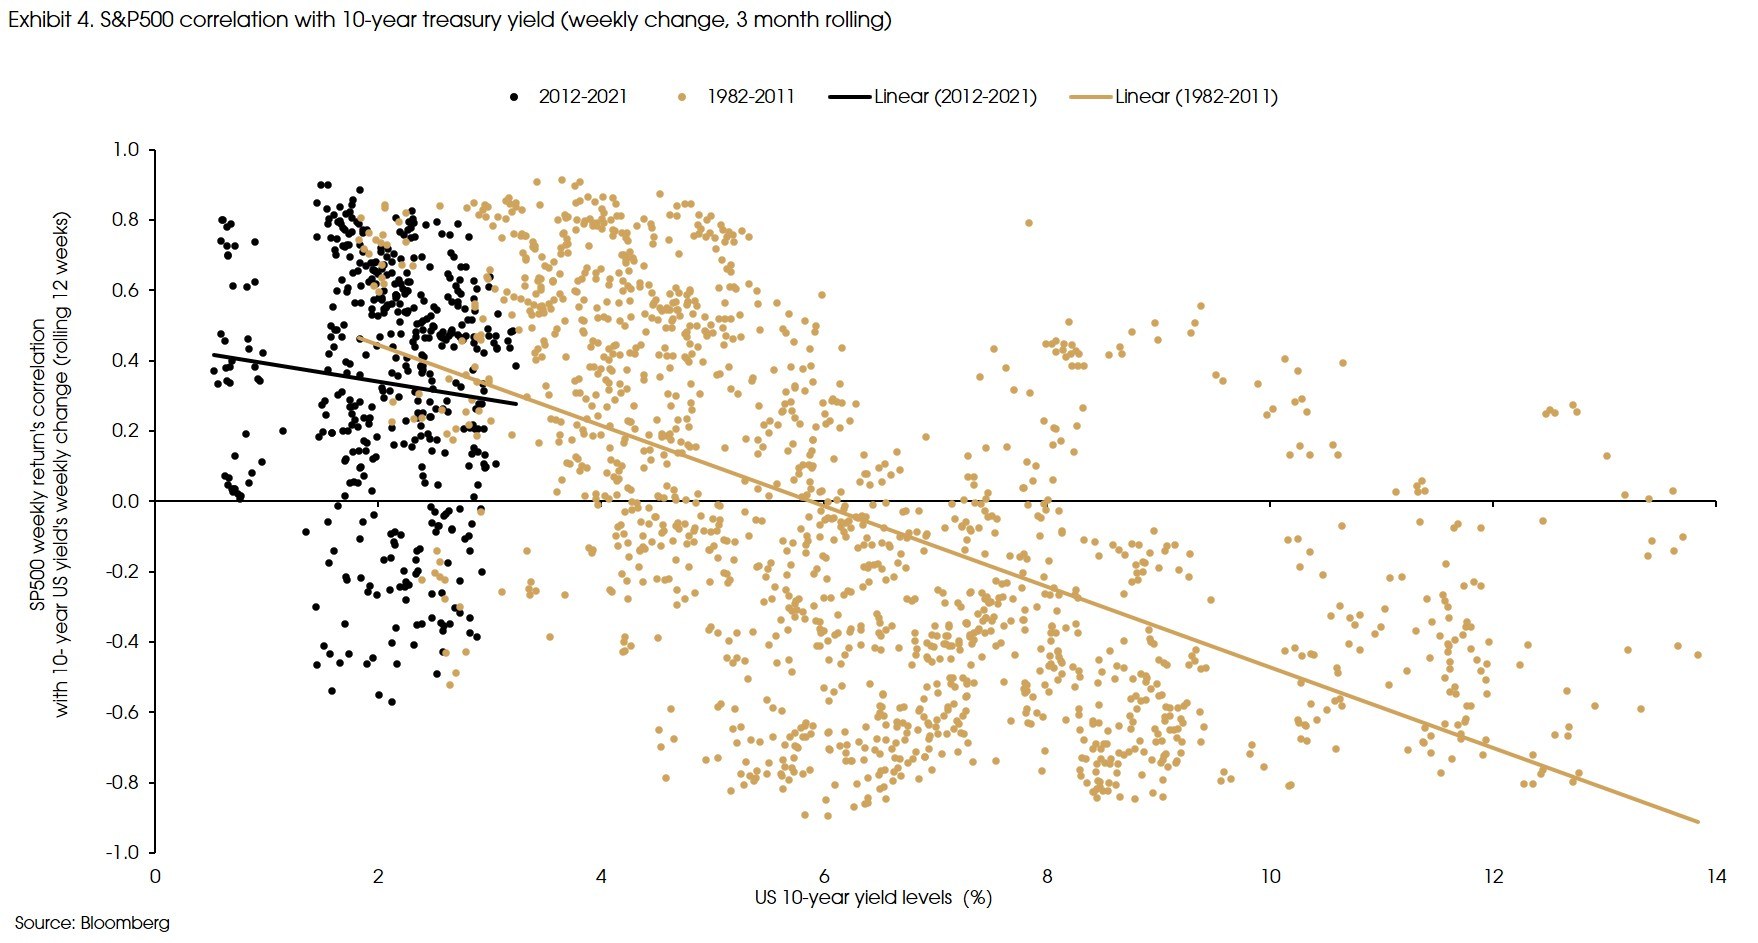
For most of the time in history, the rising interest rate will lead to falling equity prices only when the absolute level of interest rate is above a certain level. However, this threshold has been declining and is now at around 1.5-2% (Exhibit 4).
Therefore, given the current 1.6% - 1.7% level of the 10-year US treasury yield, further quick rises in yield may lead to corrections in stock prices.
That said, despite the short-term corrections, we are still at an early stage of the recovery, where equity should outperform most other assets.
In Exhibit 5, we categorize the historical annual returns of different asset classes into four conditions: increasing or decreasing US GDP growth and increasing or decreasing US 10-year treasury yields. It shows that equities generally perform well under the "rising growth and rising interest rate" condition.
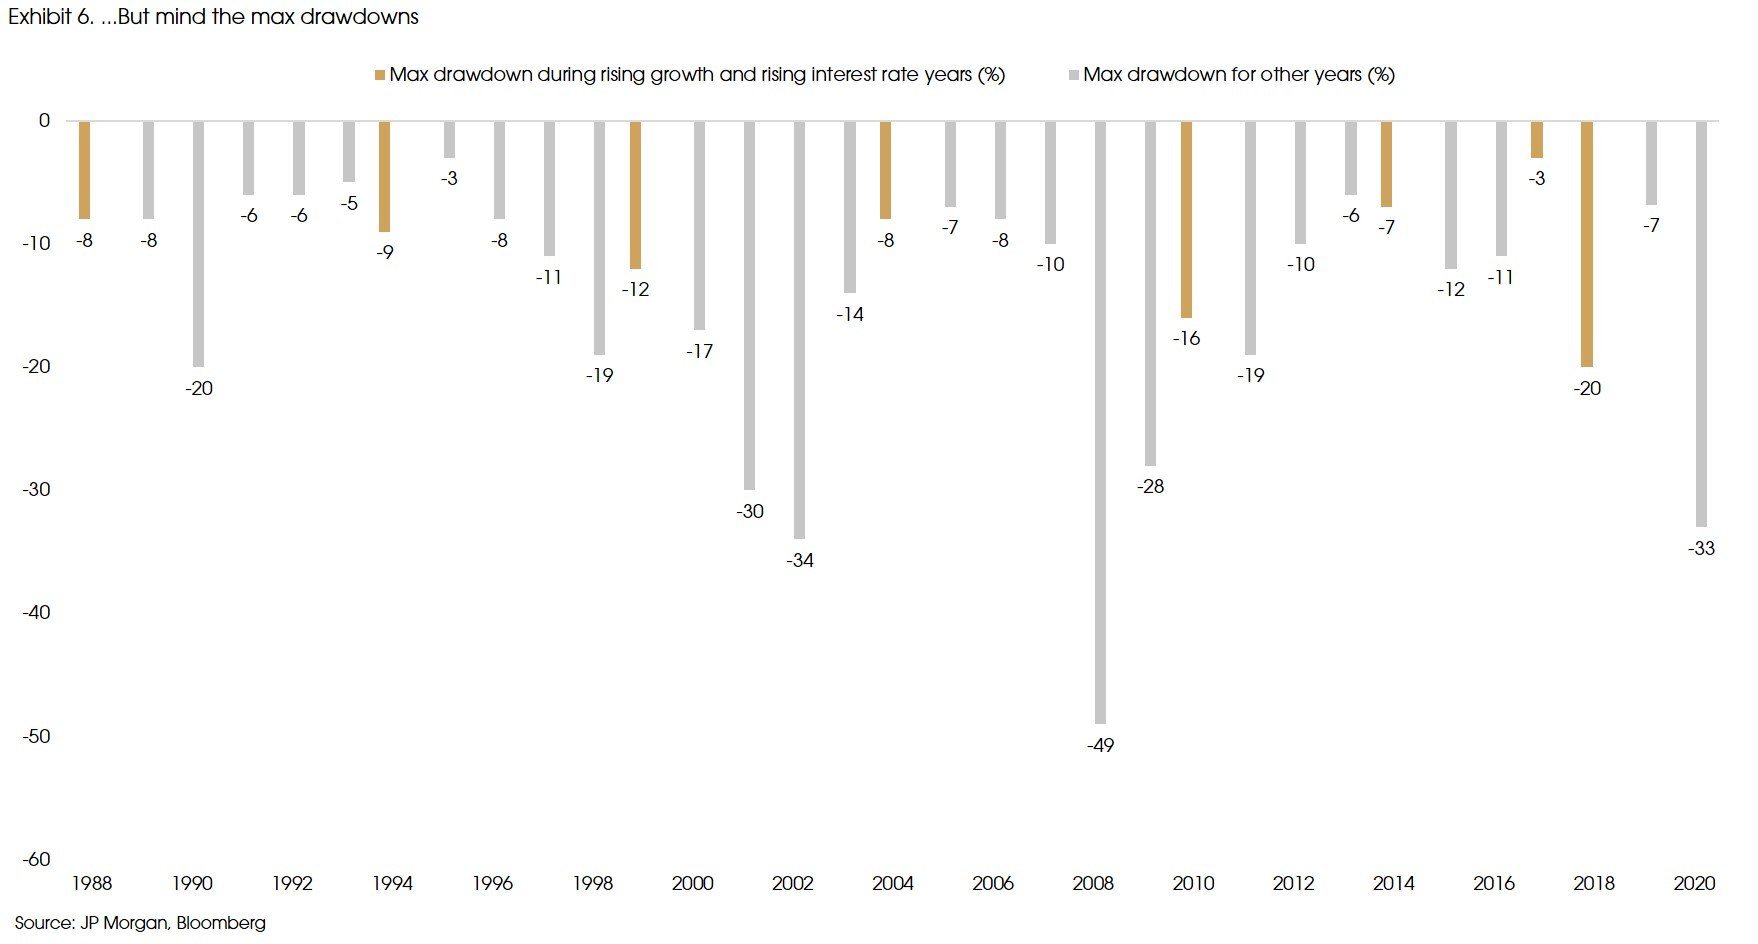
However, rising interest rates will lead to increased volatility in the market. The maximum drawdown during the years with rising GDP growth and interest rates can be as large as -20% (Exhibit 6), as a reference, the year-to-day drawdown of the S&P500 was only -4%.
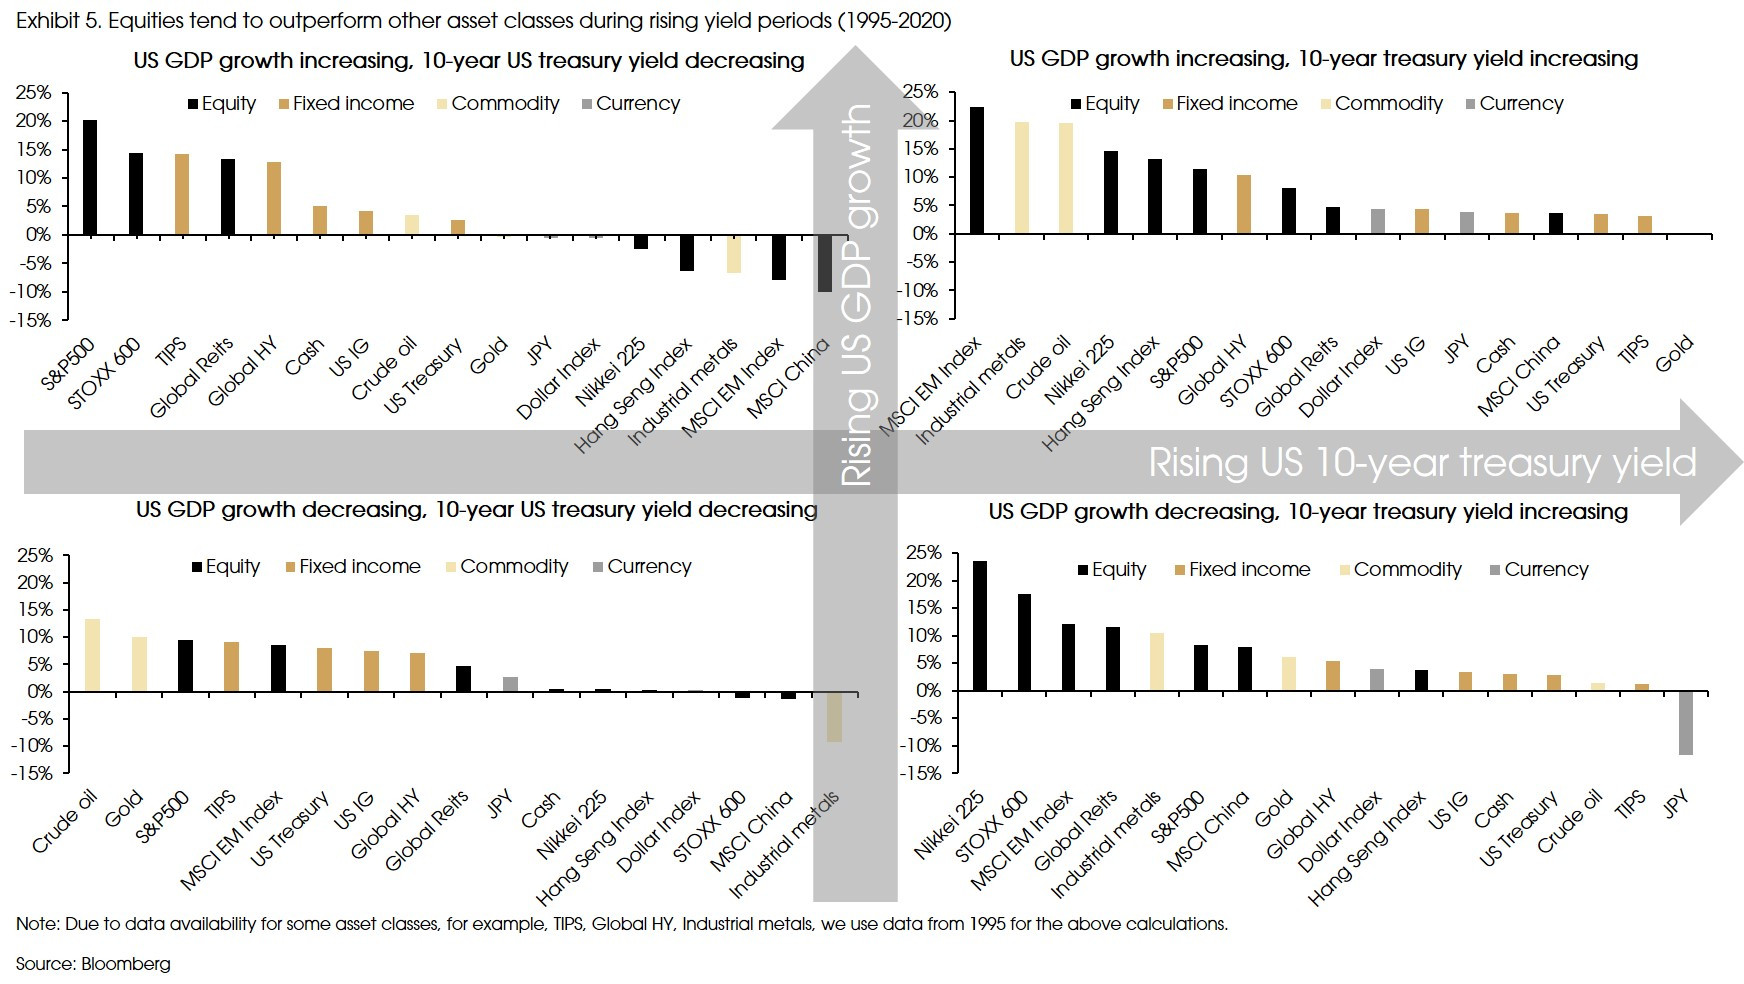
Therefore, how to hedge against the rising yield? Increasing the weight of traditional safe assets (investment-grade bonds, treasury bonds, gold, and cash) may not be the best way (Exhibit 5): the performances of these assets are under more pressure from the rising inflation and rising interest rates.
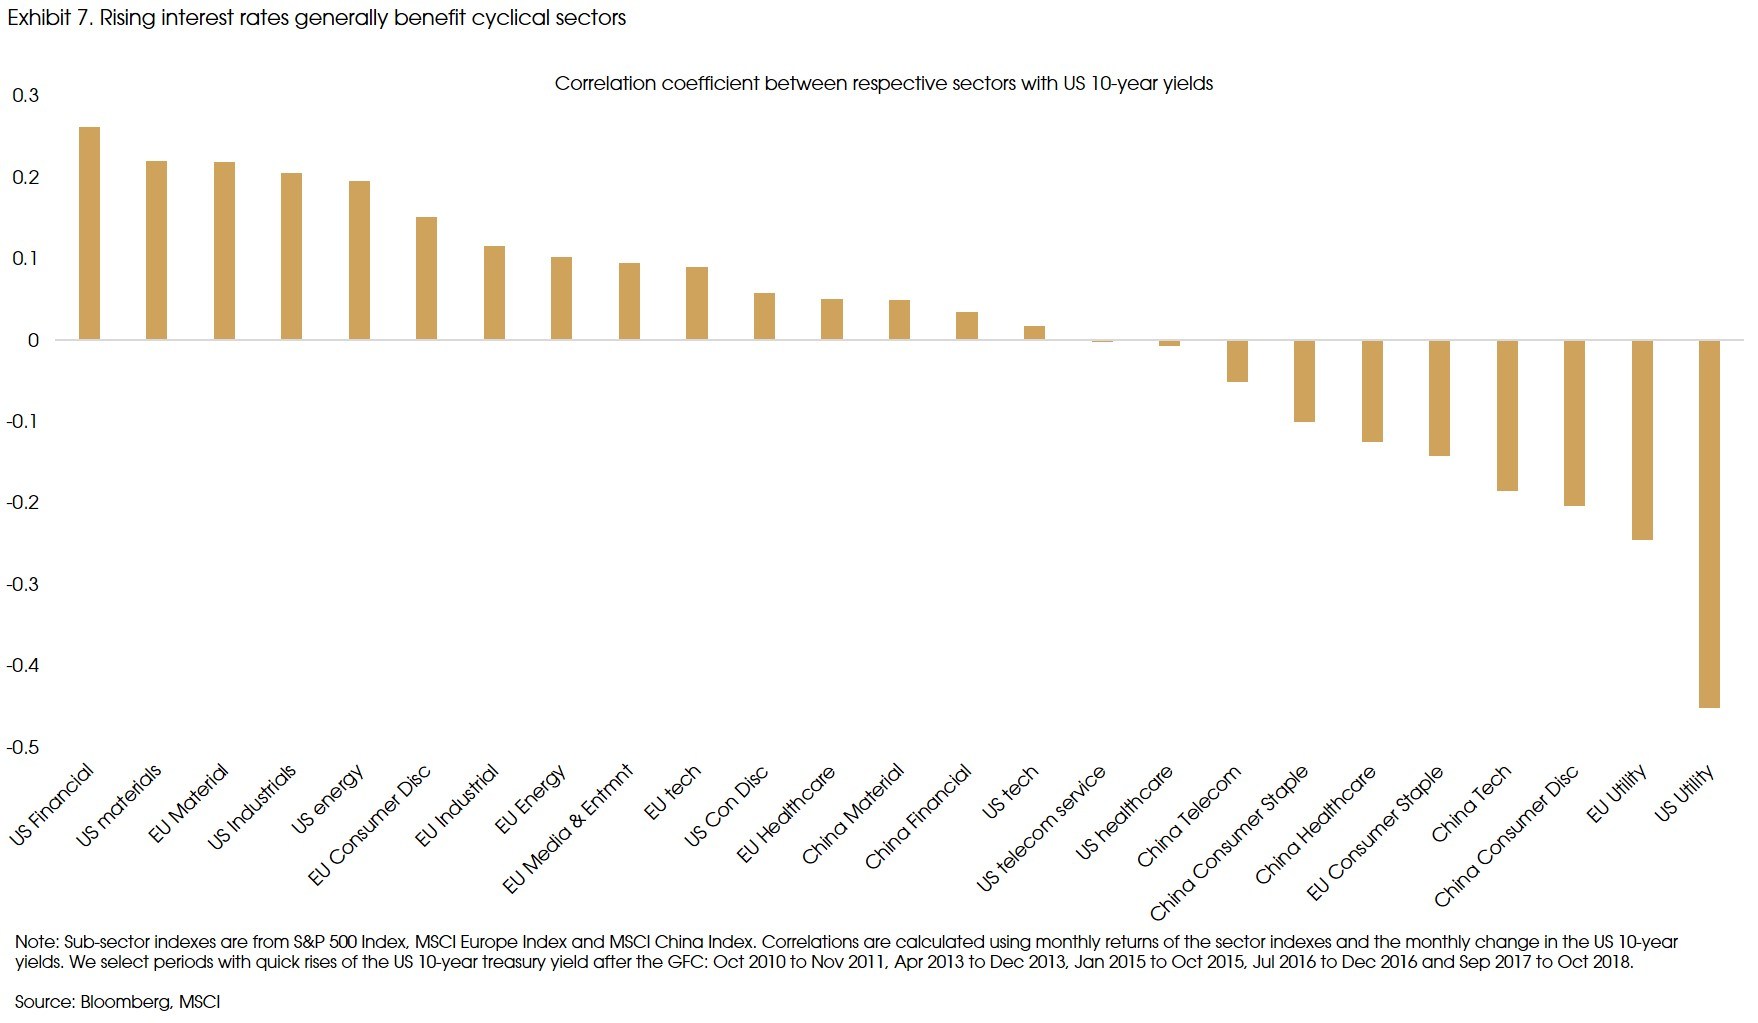
Adding the weight of pro-cyclical stocks and the beneficiaries of the rising interest rates may be a better way. Data from 2010 show that the US's financial sector has the strongest relation of benefitting from a rising interest rate, followed by materials, industrials, and traditional energy sectors in the US and European market. Meanwhile, tech sectors do not necessarily take a harder hit by rising interest rates. Instead, they are less correlated with rising yields, based on our calculation. That said, their current high valuations remain the most significant concern.
Why do we still like growth stocks?
Tactically, we have good reasons to reduce the weight in growth (or specifically tech) names and balance towards value and cyclical. However, we still like growth names, or more specifically, tech stocks. Especially if the long-term declining trend in the US 10-year yield still holds, then tech may continue to outperform regardless of short-term corrections.
On the other hand, if, as Lawrance Summers predicted, we will have high inflation, rising interest rates, and another recession led by the Fed's rate hikes, then cyclical might be hurt the most at the end.
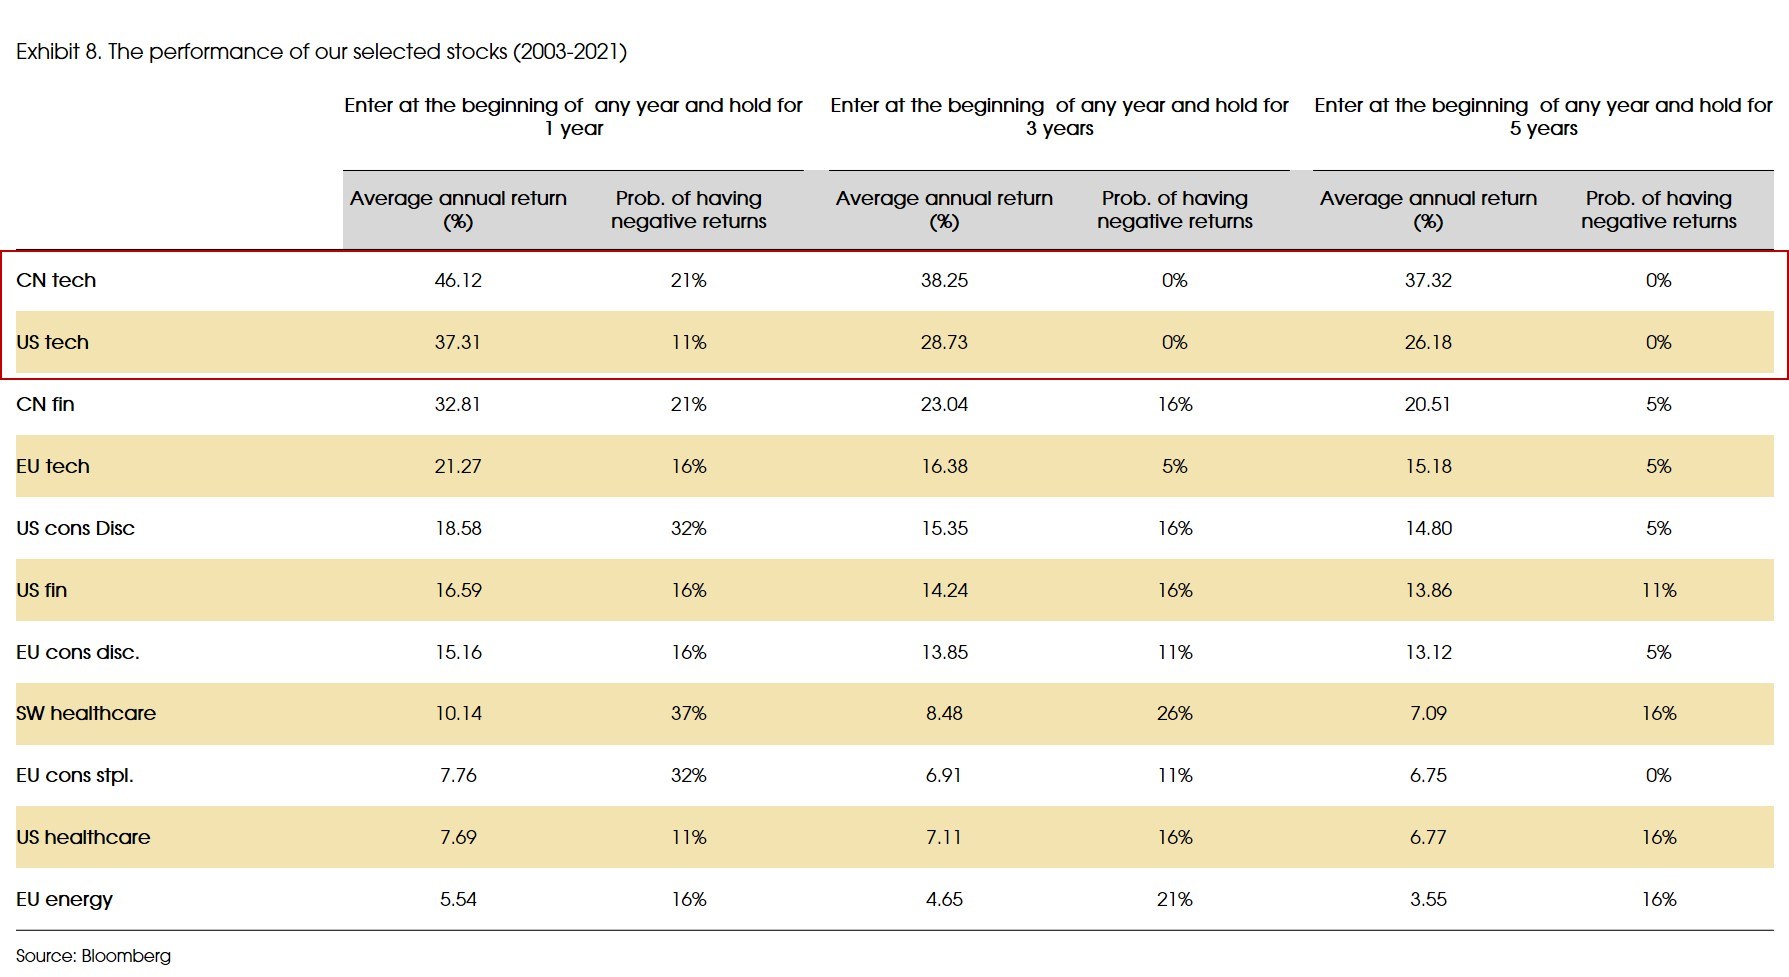
Finally, based on a basket of stocks that we have been closely watching, tech stocks (both the US and China) are clear winners in the medium to long-run. So far, they have the highest returns for different holding periods (1-year, 3-years, or 5-years) not only since the post-2008 period, which is typically branded as the "growth outperform" period. Such period can also be traced back to earlier years since 2003 (several of the stock only got listed after the 2000s). Specifically, the sector performances of our selected US tech and Chinese tech stocks had zero negative returns for holding periods equal to or longer than three years, if entered at the beginning of any year during the period (Exhibit 8).
Finally, on bonds, they may still not seem attractive for now. However, if our view on the long-term yield is correct, then when the 10-year yield approaches 2%, it may send a signal of adding back bonds and duration.
