CIO Viewpoint: Will The Rising Inflation and Fed Tightening Curb Asset Returns?

Rising inflation has been a key focus this year, especially in the US, which has led to the tightening turn from the Fed. However, there are diverging views on whether such inflation pressure is transitory or more persistent.
This is important as different kinds of inflation have different policy implications: transitory inflation may lead to a dovish tightening, like the last one in the US from 2015-2017, but stickier inflation may lead to more aggressive actions from the Fed.
In this report, we aspire to address why we still think the current inflation is a more transitory one that should lead to a gradual rate hike from the US and draw a general picture of moderate tightening’s impact on the market.
Inflation in major economies: the diverging landscape
Globally, despite the synchronized recovery among major economies, the inflation pulses are very different (Exhibit 1).
CPI inflation in the US and Eurozone has reached 6% and 4%, respectively, but Japan is still struggling with deflationary risks. Japan’s headline CPI stayed negative most this year, which turned positive recently but still only at around 0.2%, while China’s CPI is also low at about 1.5% despite the near 10%, surging PPI in both countries.

Inflation is mainly caused by two forces: 1) supply shortage and 2) excessive demand. Probably, no one would argue that supply bottlenecks exist broadly within major economies. Thus, the different inflation pulses among major economies should come from the demand side.
Specifically, economic growth in the US and Eurozone has been well supported by large scales of monetary and fiscal stimulus. Meanwhile, policy support has been restraint in China and Japan (Exhibit 2).
Japan’s case is a bit special, however. The Japanese government also handed out trillions of yens directly to households; the economy’s unemployment rate did not rise at all (stayed at around 3%) during the recession; wage growth also picked up this year, but consumption growth and economic recovery remain weak. The US GDP has already reached 1.8% above the level before the pandemic; the Eurozone GDP also regained its pre-pandemic level in 3Q 2021, while Japan’s GDP is still about 3% below that level.
We think that one reason for this can be the lower consumption propensity of the country due to the aging issue and the long-lasting shortage of labor, which led to a higher household savings rate and less effective fiscal stimulus (muted reactions from consumption).
The different landscape of inflation and Japan and China’s cases suggest that supply shocks themselves can hardly pass the upstream price pressure to the downstream and lead to consistently higher inflation in the economy.

Aggressive tightening due to the higher inflation?
For the higher, broader, and seemingly more persistent inflation in the US and Eurozone, a quick recovery in demand (supported by expansionary policies) and a struggling supply-side response are both key drivers.
However, we still do not expect to see a persistent rise in inflation which will lead to aggressive rate hikes or central bank balance sheet reductions in these economies, at least not for the foreseeable future. Both supply and demand-side driving forces for higher inflation should ease going forward.
For the US, we use a combined measure including shipping conditions, semiconductor prices, used car prices, natural gas, and coal prices to capture the supply bottlenecks, and we find the measure has been a good leading indicator for the rising core CPI in the US this year (Exhibit 3).

As big drivers of supply-side disruptions are mostly in the COVID-sensitive sectors, they should ease, at least gradually, with the improvement of pandemic conditions. Currently, this measure seems to have suggested that supply disruptions stopped getting worse.
Moreover, from the demand side, household spending (measured as personal consumption expenditures) has “fully recovered” and reached above the pre-pandemic level. However, the labor supply is still far from a full recovery (Exhibit 4).
This gap between the recovery of household consumption and labor supply is generally in line with the view that fiscal stimulus from the US government has been key to support consumption (and demand).
However, as the pandemic-specific fiscal measures have ended and the following infrastructure and social welfare packages are more long-term focused, thereby, much less front-loaded, we probably have already passed the peak of policy support. Thus, the demand-side driving force is also declining.

Moreover, for the TIPS-implied inflation expectations, they have surged significantly this year. However, the slope of the inflation expectation curve has turned negative as well. Specifically, long-term inflation expectations remain within the post-2008 range, while the spread between the 10-year and 2-year inflation breakeven is at a 16-year low. Such changes suggest that inflation pressure/concern is significantly front-loaded.
Therefore, we are hopeful that we are dealing with the peak rates or near-the-peak inflation rates in economies such as the US and Eurozone. After the supply bottlenecks are eased, and policy stimulus fades along with the improving pandemic conditions, inflation in these economies might even surprise to the downside.
At least, there is reasonable uncertainty surrounding the power of inflation and we maintain the view of transitory inflation.

Of course, there are risks to such a view. For example, the most recently discovered new COVID variant in South Africa may reverse the supply-side improvement. Policy support in major economies may also last longer and provide more support, leading to higher and stickier inflation.
However, even if we are going to see inflation hovering at higher levels for a longer period, we think that the risks are balanced towards the “moderate tightening side” for major economies. Specifically, central banks such as the Fed and the ECB may remain cautious in taking aggressive tightening measures, as policymakers know how to deal with rising prices but are less confident dealing with declining ones.
Therefore, an earlier rate hike from the Fed is likely, given the currently surging inflation, but it should be a gradual one like the previous rate-hike cycle due to the transitory nature of the inflation.
A moderate tightening from the Fed may also leave more room for other central banks to stay accommodative to support economic recovery, for example, the ECB, the BoJ, the PBoC, and some EM central banks with limited currency depreciation and external debt pressures (e.g., Emerging Asian countries).
Asset performance during moderate tightening
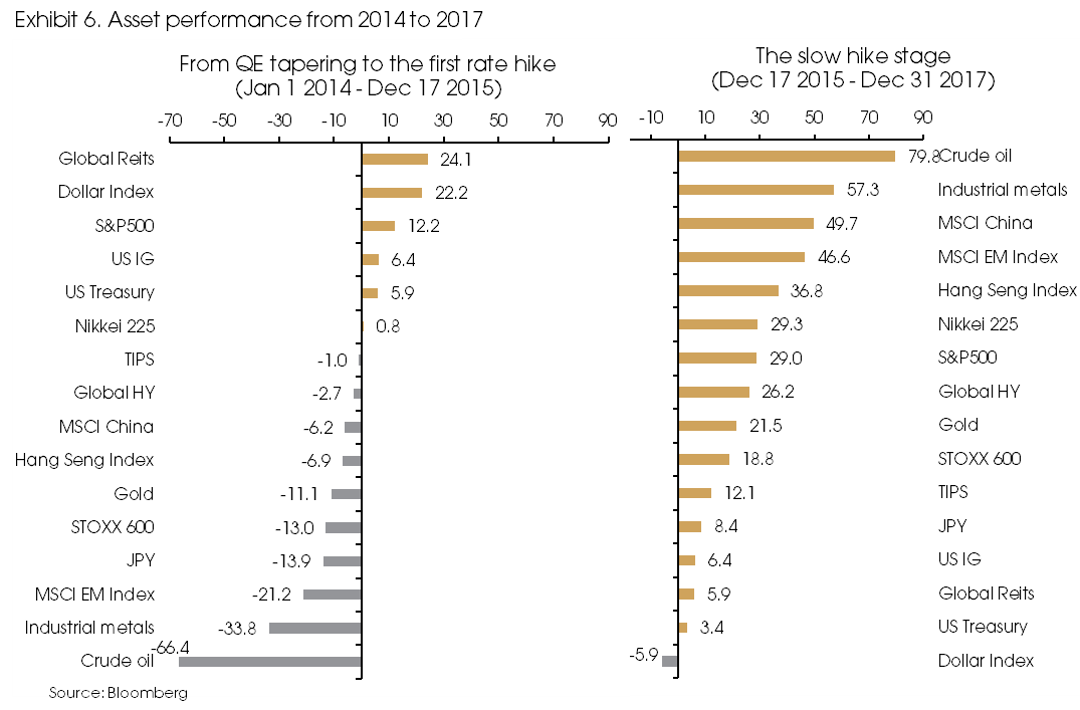
To give a general picture of moderate tightening’s impact on asset prices. We calculate asset performance after the start of the previous QE tapering in Jan 2014 until the first rate hike in Dec 2015 and the performance between the first rate hike until the end of 2017 (the dovish-hike-phase of the Fed).
Asset performance between the start of QE tapering and the first rate hike (Jan 2014 – Dec 2015) period was generally in-line with the dynamic of a stronger dollar. During this period, US assets were the only winners (Exhibit 6, left panel).
Specifically, the dollar rose sharply on the tightening stance from the Fed, while the euro was still under pressure, given the lingering risks from Greece and the debt crisis. The dollar strength and the US assets were further boosted by the EM economic downturn, especially the one in China. The deleveraging policies from the Chinese government significantly dragged the economic growth, and the RMB exchange rate reform led to the huge depreciation of the Chinese yuan and mounting capital-outflow pressures.
As a result, commodities fell, EM assets were under great pressure, European market was also weak due to the residual risks from the eurozone debt crisis.
However, such a monetary policy gap (a tightening Fed vs. the still accommodative stance from other central banks) between the US and the rest of the world is not in favor of the US economy in the longer term. It may lead to a shift in growth momentum from the US to other economies and curb the dollar strength, leading to the catch-up and rebound of non-US assets. That is exactly what happened from late 2016 until the end of 2017.
The slow rate hikes by the Fed during 2015-2017 not only provided a notable cushion for the US economic growth to remain solid, supporting US assets, it also left considerable room for other central banks to stay accommodative. Such a dynamic helped non-US economies and assets to narrow the gap with the US. All assets rose during the slow rate-hike period, despite the dollar, and commodities and EM assets rebounded the most (Exhibit 6, right panel).

However, for this cycle, not everything will be repeated for sure. Both EM and European economies are more solid fundamentally. For China, although the regulatory crackdown has put significant pressure on growth, the Chinese yuan has remained quite strong against the dollar even with the dollar strength, suggesting better fundamentals of China’s economy compared with the 2014-2015 period. Moreover, the Chinese government has started to fine-tune regulatory measures to support growth (e.g., in education, entertainment, and the hard-hit property sectors).
Thus, the logic of dollar strength will probably hold, but with a much milder impact compared with the previous cycle, given the solid fundamentals of non-US economies. In other words, we still expect to see pressure in EM assets and commodities along with the tightening Fed (although to a milder extent).
However, such pressure will ease if the US rate hike is gradual, and the growth momentum shifts towards other economies (expected in 2H 2022). That may lead to a more solid and meaningful rebound of commodities and non-US markets.
Mind the correction risks of the US market
The currently strong earnings growth, optimistic market sentiment, and the previous experience during 2014-2017 all seem positive for the US market, indicating further gains.
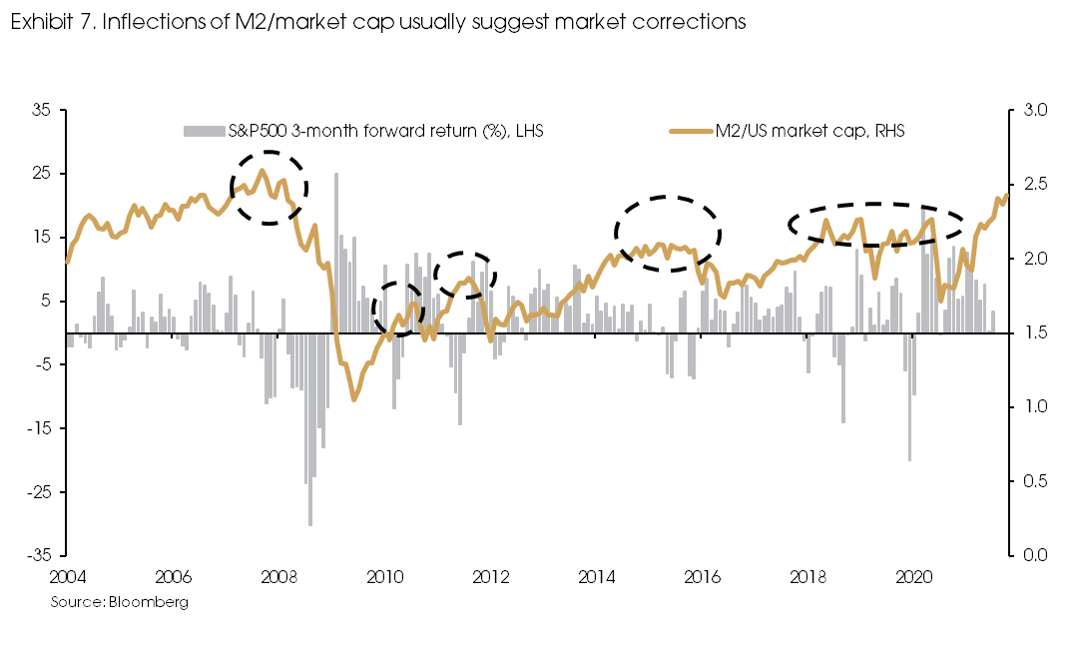
However, there are risks. Back in 2014-2015, the P/E ratio of the S&P 500 was around 17x (near historical average), but now it is at the high-end of 22x, suggesting downward pressure. Other indicators are pointing in a similar direction. The ratio of the US stock market capitalization to money supply (M2) is running high, despite that M2 has expanded exponentially since last year, suggesting that the impact of the explosive money growth is already reflected in the surge of equity prices. Historically, when the ratio is high, the vulnerability of the stock market increases (Exhibit 7).
Besides, there is an extra layer of uncertainty over corporate earnings growth, given that the economy is passing the hyper recovery phase next year. Both valuation and earnings outlook indicate risks of higher volatility in the market.
During the previous cycle, the maximum drawdown in the US market increased first from -7.4% in 2014 to -12.4% in 2015, and volatility decreased during the slow rate hike stage from 2016-2017.
Therefore, the US market may continue to rise, but with increased volatility going forward, especially for the 1H 2022, before the start of the rate hike.


