
CIO Viewpoint: Short and Sharp - The L, U, or V Curve
Markets have been roiled by the fast-moving and fragmented news of COVID-19, also known as coronavirus, which has caused not only human infection and death worldwide but severely disrupted transportation networks, supply chains and manufacturing capacity worldwide. This is a test of China’s integration to the global economy and the global economy’s integration to China’s manufacturing prowess. If the result is successful, it may earn it increased credibility in its long term pivot to cementing its leading economic powerhouse position in the global economy. We think China will successfully navigate through these challenges.
Financial markets are still sorting out how to price the ever-evolving risk. At the time of writing we feel markets and investors have, in part, moved onto discounting other market risks, as evidenced by eight straight positive sessions in a row of the Shanghai equity composite, CSI 300. However, it could turn quickly. Economists, central bankers and market participants alike commonly describe historical economic scenarios and data graphically as an L-shaped-curve, a U-shape-curve or a V-shaped-curve; what we might term the L U V curve. This helps to give some visual context to economic activity in order frame investment decision making in the face of grand unknowns.
Regardless, we stress that there is an immense amount of uncertainties in respect to the fall-out from COVID-19; it is simply too early to reliably place probabilities on outcomes at the time of writing. However, we think this period will be short and sharp and characterized by a ‘V’ shaped vector in respect to economic data point series.
Even so, as investors we suggest to remain rational and see through the crisis. Markets often over react. In the interim, we still expect and await for markets to price in the US 2020 presidential elections, especially as Super Tuesday, which is named for the plethora of states all voting in primaries on March 3, approaches. As always, fully diversified multi asset portfolios are one of the best ways to weather uncertainties in markets over the long term.
China GDP
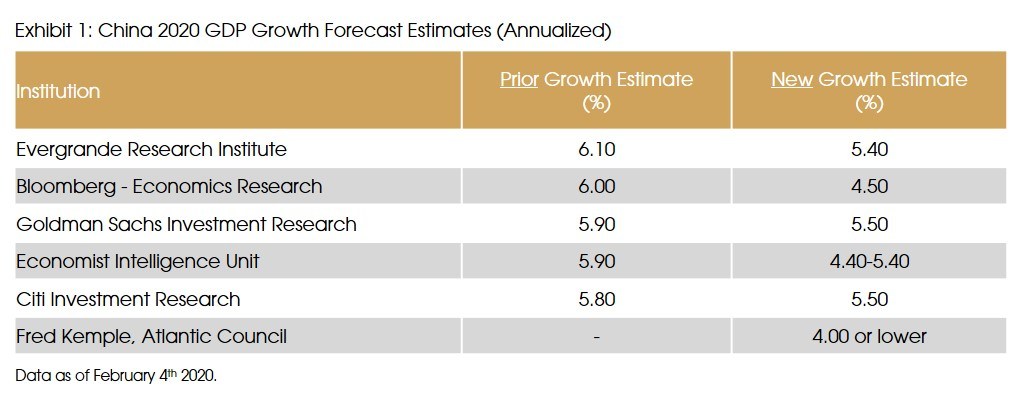
China’s share of global gross domestic product (GDP) is now approximately 16% versus approximately 4% in 2003 at the time of SARS in 2003. One-third of global growth comes from China and even more when compared only to emerging markets. The PBoC (People’s Bank of China) had officially targeted 2020 GDP growth at 6% but this is now in doubt and consensus is that they are likely to revise this goal. Most forecasters now expect a sub-5.5% 2020 GDP growth with some estimates as low as 3.8% (UBS) and others more moderate at 4.4-5.4% (Economist Intelligence Unit). See Exhibit 1. We expect the IMF and World Bank to publish lower global growth (currently 3.3% and 2.5% respectively) and emerging market forecasts for 2020 as soon as there is enough information to make proper estimates. It could be several months.
On-the-Ground
In lieu of the dearth of economic read outs from China, we’d turn to the corporate sector to give us an indication of the sentiment on the ground. Key manufacturers with operations in China, such as auto-makers, semiconductors, consumer electronics and consumer goods all reported extended Lunar New Year holidays and delays in re-opening facilities. We caution that these factories are unlikely to be at full capacity for the foreseeable future while permission is granted, inspections completed and adequate protective gear procured and new policies are implemented for factory workers. Specifically, these companies’ effectiveness to return production, output and operations to pre-crisis levels will be key to profits. Generally, we think larger and more established companies will be more successful due to their greater resources and flexibility
Still, quantifying impacts at this stage has too low of a probability for reasonable accuracy. Longer term considerations will include the inevitable investor realization and market pricing that supply chains and manufacturing activity is still overtly centered on China and we firmly believe that companies will continue to pursue supply chain diversification strategies as a way to mitigate production risks.
China’s Toolbox
As mentioned in our January CIO Newsletter, emerging markets have more latitude to effectuate monetary policy than developed markets do. This is led by China’s vast toolbox. For example, on February 3, the PBOC injected more than USD 170bn in liquidity to the 7 and 14 day repo markets. It appears to have worked as stock indices in China had an initial sell off of more than 7% on the first day after the extended Lunar New Year break and have been less volatile since then. We expect more cash injections to come. The PBOC has also cut reverse repurchase rates by 10bp after already doing so in early January. It is common for the PBOC to make such cuts to the reserve requirement. While pundits argue that the tangible impact is minor, this time may be different if the desperation of smaller businesses’ credit demand bubbles up to the banks. Yet, credit growth remains an outstanding risk in an increasingly leveraged economy. It is possible that this level of stress may push some banks’ non-performing loans upwards. However, this remains to be watched.
Moreover, we expect policymakers to continue to announce and roll-out provincial level fiscal plans that will be targeted at small businesses, and bolster local provincial governments. For example, already in Southern China’s Guangdong province, the government passed 15 measures to help businesses impacted by the fall in economic activity due to the outbreak. They include financial aid, tax cuts, rental relief and moratorium on foreclosures and increased state owned bank lending quotas. At a national level, subsidies and tax cuts for people and companies involved in epidemic prevention and control will be rolled out, while value-added tax will be waived for taxpayers in sectors such as transportation, catering and daily necessities, according to Xinhua News. These fiscal activities will be crucially complementary to the likely coming exhaustion of monetary tools in China’s box.
What to Do: The ‘V’ Formation
It is widely understood that economy activity will likely take a precipitous fall in the first quarter, but critically we await official economic data reports from China to confirm this. This angst adds to investor confusion and irrationality. As such, we believe the current uncertainty in the market is temporary as traditional fundamental economic information comes to light and is priced into the market. Broadly, we expect China’s economic data, such as GDP, consumer demand, industrial production and business activity, to first show a steep vector downwards followed by a sharp angled upwards vector, and as such a ‘V’ formation. The timing of this is far less clear but at the time of writing we think Q2 will begin to show some rebound from likely dismal Q1 data. This is why in the interim we look to indications from the corporate sector domestically to support our qualitative view.
For portfolios, we fully expect more market volatility in 2020 and having an all-weather style implemented through diversification of asset classes, currencies and countries will likely help to balance the negative effects from the global economic fall-out from China’s likely V shaped trajectory.
Sources: Atlantic Council, Bank of America Private Bank, Bloomberg, Blackrock Investment Institute, Citi Investment Research, Evergrande Research Institute, Goldman Sachs Investment Research, JP Morgan Investment Research, Julius Baer, Lombard Odier, Neuberger Berman, Pictet, Reuters, The Economist, The Financial Times, The New York Times, The Wall Street Journal and UBS Investment Research.