
CIO 2H 2024 Outlook: A Rather Favorable Stance
Author: Yao Wang and Jess Cheung Editor: Nicolas Sioné

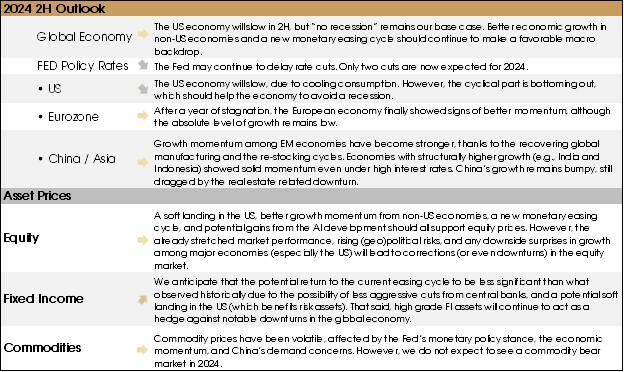
Global equities had an encouraging 1H of 2024, with a number of markets reaching new highs. One can wonder whether such positive momentum can persist in the second half of the year. We see a favorable backdrop for equities in the coming quarters, given 1) the soft-landing in the US (base case), 2) improving growth momentum from non-US economies, 3) the start of the global monetary easing cycle.
However, risks are skewed to the downside. High interest rates and high inflation may lead to a deeper than expected downturn in the US economy. European political risks have already hit local asset prices. At the same time, the upcoming US election and any potential flare-up of the Middle East/Russia-Ukraine geopolitical tensions will, at least, increase market volatility.
We therefore continue to consider the fixed-income market as it offers attractive yields and carry and can serve as a buffer against unforeseen impacts derived from lingering uncertainties.
The 1H of 2024 has been bumpy for fixed-income investors, with central banks continuing to delay their first rate cuts. Riskier bonds such as HY and leveraged loans led the returns despite higher defaults.
The current market conditions still make for an ideal combination for credit investments, with 1) a decelerating U.S economy, alongside sustained resilient growth; 2) improving corporate earnings resulting in a moderate level of credit risk and 3) the impending cycle of interest rate cuts further enhances the appeal of credit investments.
1- “Soft-landing” expectations in the US
The status of the US economy remains one of the key factors in determining global asset prices.
The US’s stronger-than-expected (and more robust than others’) economic growth in 2023 ignited the risk-on sentiment and led to the US outperformance last year.
In light of the US economy's resilience, investors started to price in a "no-landing" scenario (economic growth keeps accelerating without a slowdown) earlier this year. However, 1Q GDP growth came in significantly weaker than expected, and the a-cyclical part of the economy that is less affected by interest rates, i.e., personal consumption, started weakening, reducing the “no-landing” expectations.
We continue to foresee a soft-landing as the base case scenario in the US. When the Fed started to hike aggressively in 2022, the cyclical part of the economy (i.e., industrial and manufacturing activities, business investment, especially real estate investment) significantly declined. However, household consumption, which accounts for ~70% of the US GDP and is less sensitive to interest rates, managed to hold up well during the rate hike stage. Service consumption (~50% US GDP) maintained a 3% average YoY growth since 2022, well above the pre-pandemic levels, which has been the main force supporting the US economy (Exhibit 1, LHS).
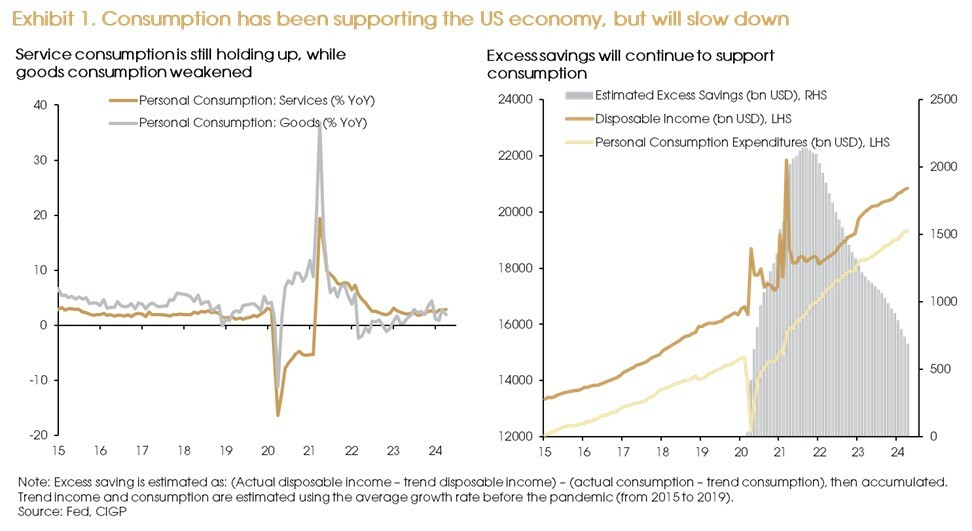
Excess savings accumulated during the pandemic have supported consumption. However, as household income and savings further normalize, excess savings have declined (Exhibit 1, RHS) (excess saving is a highly approximate measure; market estimates vary between 0 and USD 600 billion). Contracting savings, higher inflation, and higher interest rates will finally lead to lower consumption growth. The consecutive weak retail sales readings in recent months could be signs reflecting this slowing consumption trend.
The consumption slowdown is the key reason underpinning a soft-landing instead of no-landing.
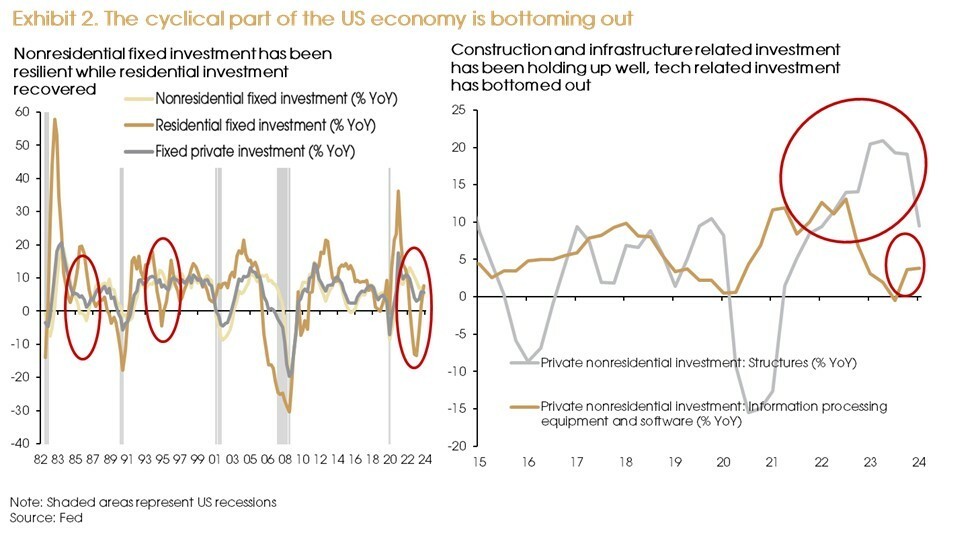
On the cyclical (rate-sensitive) part of the US economy, however, there are signs of improvement, reducing the risks of a hard landing. As the rate hike cycle ended, both business and residential investment started to bottom out (Exhibit 2, LHS).
Non-residential business investment has been faring better than the residential sector during this rate hike cycle. Supply chain relocation and fiscal stimulus from the US government (through three acts) led to a surge in construction and infrastructure-related investments. In addition, the AI boom allowed for a rebound in Tech equipment and software-related investment since 4Q 2023 (Exhibit 2, RHS).
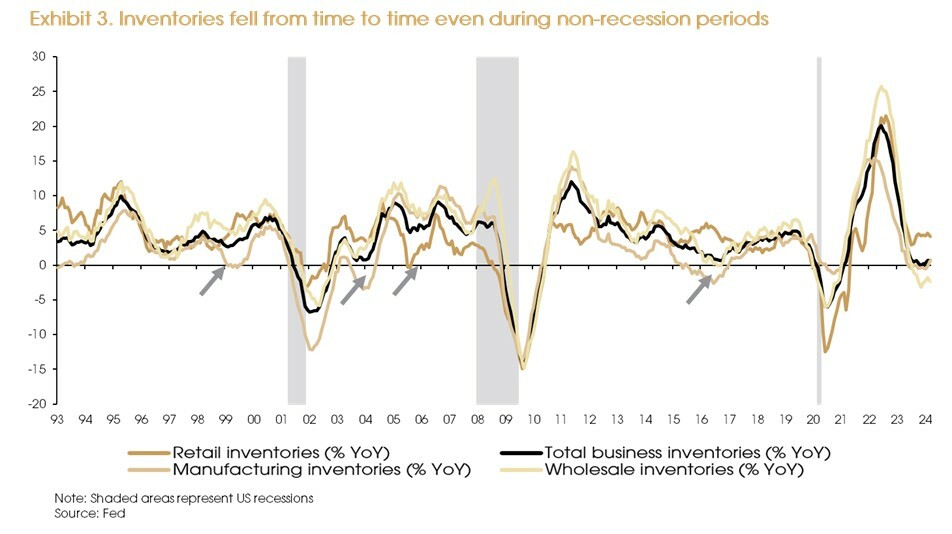
Inventory was one of the key drags on US 1Q GDP growth. Although disparities exist across different sectors, the overall trend is stabilizing after the big downturn since mid-2022. Inventory has always been the volatile part of the economy and tends to dip into negative growth from time to time during the non-recession periods (Exhibit 3).
We believe, the fiscal stimulus has successfully led to a less synchronized growth dynamic across different parts of the economy. When the cyclical sectors (i.e., industrial, business investment and real estate) were hit by rising interest rates, consumption remained stable; and now that consumption starts to weaken, we see rate-sensitive sectors having already troughed and starting to gain momentum as interest rates stopped rising.
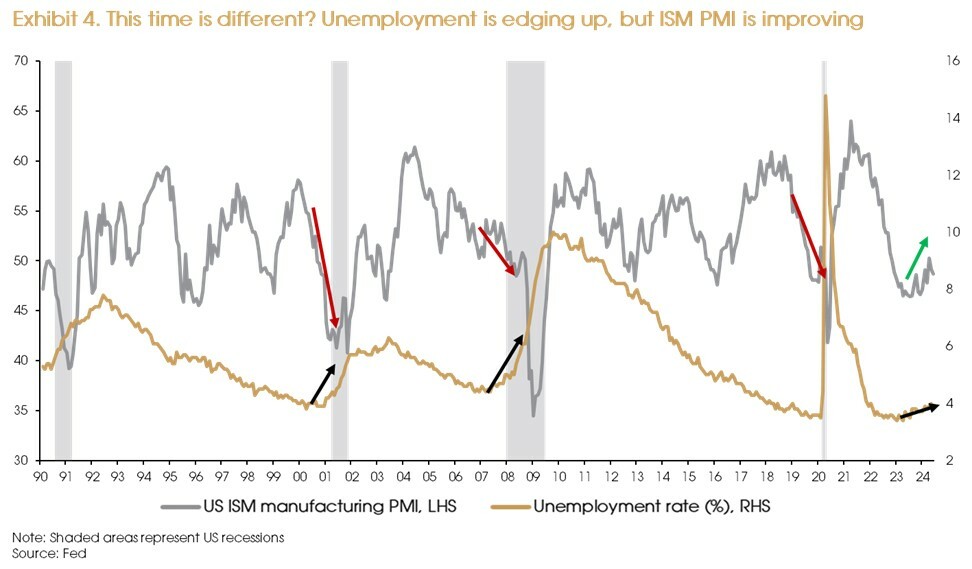
If we put the most lagging indicator (i.e., unemployment rate) and the most leading indicator (i.e., ISM manufacturing PMI) in the same chart, the picture gets clearer (Exhibit 4). The unemployment rate edging up from the bottom tends to coincide with an on-site recession. Usually, by the time the lagging part of the economy starts to deteriorate, the other parts have already been deteriorating for a while and continue their decline, leading to a broad-based downturn, i.e., a recession. However, this time around, upon the unemployment rate edging up, we observed that the cyclical part of the economy had already troughed and was recovering, facilitating a soft-landing.
Of course, the materialization of a soft landing still depends on whether the improvement in cyclical sectors can be sustained. However, one more thing to remember: After the aggressive rate hikes, there is plenty of room to support economic growth from the monetary side, if needed.
2. Positive growth momentum and monetary easing from non-US economies
A soft landing in the US is the most important factor underpinning a favorable global economic backdrop. There is, however, more to be said.
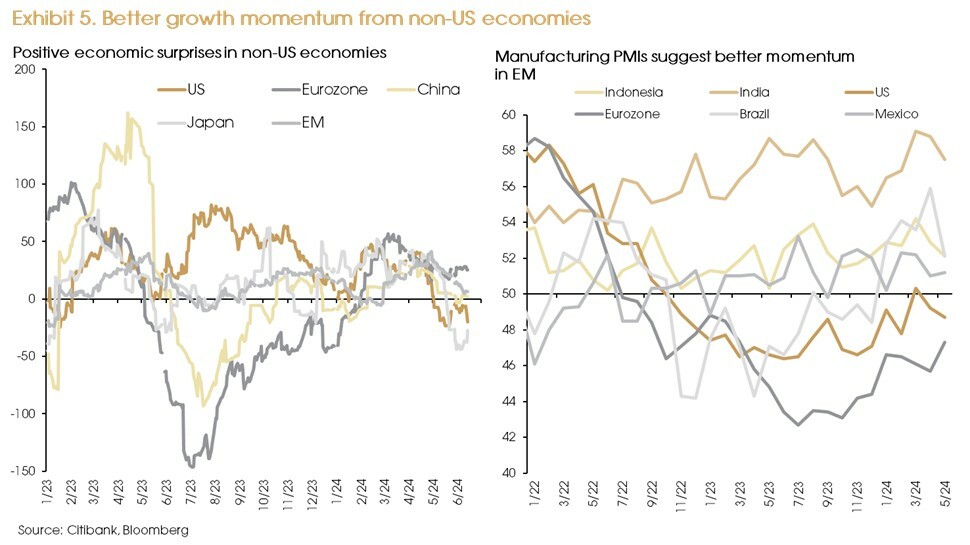
First, as recent data started to show slowing momentum in the US, data from non-US economies started to improve. The Citibank economic surprise indexes showed negative surprises in the US since May. However, after stagnating for more than a year, the Eurozone economic data has surprised to the upside so far this year. Similarly, data from emerging markets was generally better than expected. China’s economy, a headache last year, also showed signs of stabilizing after the government finally released “to-the-point property market policy”, shunning the debt-deflation risks (Exhibit 5, LHS).
The recovery of the global manufacturing cycle and the start of a new restocking cycle were the main reasons behind this improvement. Even Japan, whose domestic demand remains weak, saw its manufacturing PMI enter expansionary territory since May. A first in over a year.
In addition, due to the pandemic-related disruptions and rising geopolitical tensions, the resilience of the supply chain has become a key consideration for governments and companies. The diversification of the global manufacturing supply chain accelerated further in recent years, benefiting a number of EM economies. FDI (foreign direct investment) inflows rose substantially in countries such as Vietnam (x2), India (+77%), Indonesia (30%) and Mexico (30%) between 2013 and 2022, while it contracted by 38% in China.
The increased FDI inflows have boosted infrastructure and manufacturing-related investment in these EM economies. Once the global manufacturing cycle initiated its recovery, we saw a stronger rebound from these EM economies (Exhibit 5, RHS).
Finally, non-US central banks kick-starting their monetary easing will further help to lift the growth outlook in non-US economies.
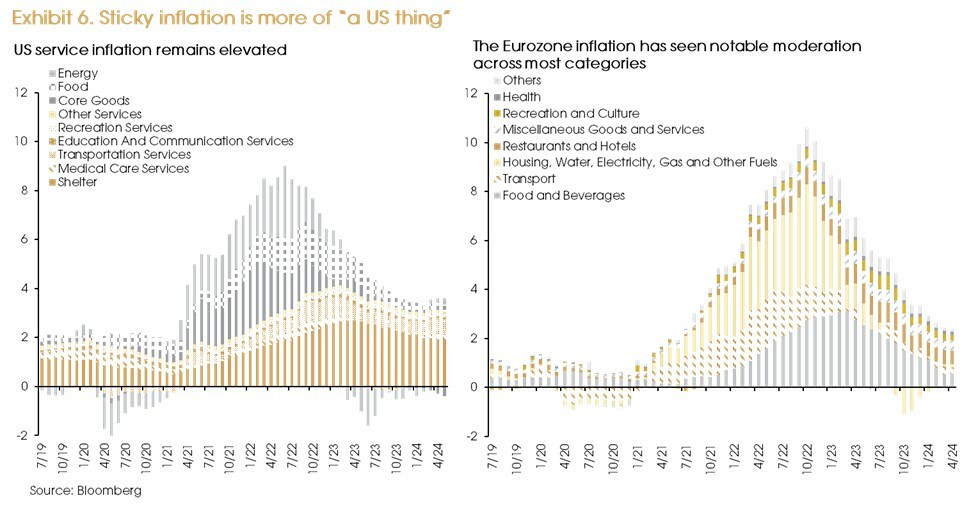
Unlike the US, most other economies do not face the sticky inflation problem. For instance, the Eurozone had an even worse inflation surge during 2022-2023 with a peak headline inflation reaching in excess of 10%. However, almost all inflation categories cooled significantly ensuing to this spike (Exhibit 6). On the other hand, shelter inflation in the US accounts for 35% of the headline and has remained at around 100% above the pre-pandemic levels for 22 months.
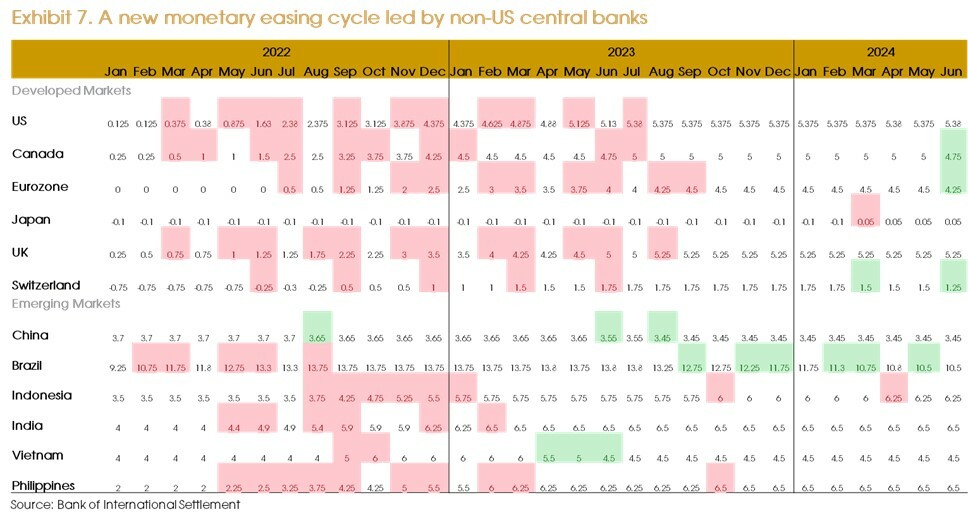
Therefore, non-US central banks have started the rate-cut cycle ahead of the Fed. Central banks in Switzerland, Sweden, Canada, Brazil, as well as the ECB (European Central Bank) have all reduced interest rates in recent months despite the Fed's “wait-and-see” stance (Exhibit 7).
We still foresee one or two Fed rate cuts in 2H this year, as the cooling US economy should re-confirm the disinflation trend, setting the stage for rate cuts. However, even with a further delayed rate cut cycle in the US, we expect continued rate cuts from non-US economies as inflation heads towards targets.
Monetary easing should further support growth momentum among non-US economies, leading to a positive outlook in global growth. That said, such policy differences will lead to a widening yield gap between the US and the rest of the world and, therefore, continued dollar strength. The dollar index surged after the Swiss National Bank started to cut rate in March and, again, after the first cut from the ECB in June.
However, foreign exchange rates are not solely decided by monetary policies. A slowing US economy, versus the better growth momentum from non-US economies, should limit the strength of the dollar.
3. Equities: Still bullish
A soft landing in the US, improving growth momentum from non-US economies, the start of a new monetary easing cycle, and the dollar's limited upside should make a favorable backdrop for equities.
In the previous cycles, a global monetary easing cycle was usually prompted by a recession and/or a financial crisis. But this time, central banks just began cutting rates as inflation declined, with no recession or crisis (yet). This is a key difference between this cycle and the previous ones, making a bull case for equities.
Marketwise, the US market still offers the best risk-adjusted return, in our view. However, given the 14.6% YTD return (as of June 21st, 2024), we may see a pullback before a further leg up.
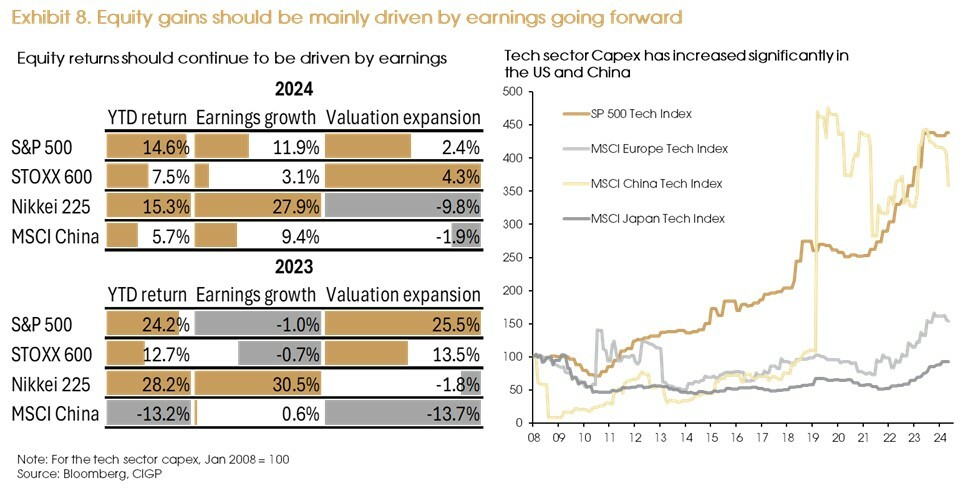
Valuation expansion contributed to most of the equity gains in 2023 (Exhibit 8, LHS). This year, however, earnings have become the main driver and will probably remain so, given the already stretched valuations and upbeat market sentiment. Currently, valuations have reached their 10-year average plus one standard deviation in both the US and Japan and rebounded from a 10-year average minus one standard deviation level back to the 10-year average in Europe. Therefore, even with monetary easing, we do not expect to see significant upside in equity valuation.
In terms of earnings, the US market enjoys a clearer picture of economic growth and policy outlook versus other markets and, therefore, benefits from a stronger (and more certain) earnings outlook. The US GDP growth is still higher than that of other developed markets (e.g., Eurozone and Japan). Although the rate cut could be further delayed, the next step is, almost certainly, “a cut”. On a relative basis, the US is also expected to benefit more from the ongoing AI development.
The US Tech sector’s capital expenditure increased the most after the pandemic (since April 2020, +74%), and more than quadrupled since 2008. Meanwhile, although European Tech companies also increased capital investment by 65% since 2020, the absolute level is not much higher than what it was back in 2008 (Exhibit 8, RHS). Similarly, the growth of Japanese Tech companies’ capital investment remained muted over the past decade.
China makes for an interesting case. The Chinese Tech sector’s capex followed the Europe and Japan’s muted path until 2018. However, after the emergence of the US-China trade war, and especially after the US imposed sanctions on Tech exports to China, China’s Tech capex surged in a bid to achieve “self-driven Tech innovation”.
Currently, China is also trying hard to develop AI technology and applications. However, it still faces a bottleneck in key tech devices (e.g., chips). The slowdown of the overall Chinese economy has also created notable headwinds in Tech companies’ revenues, limiting their ability to increase capex (which fell -18% since 2021) and dampening potential gains from the AI trend.
The US therefore remains the top beneficiary in the new Tech cycle. We see some interesting trends in the US market.
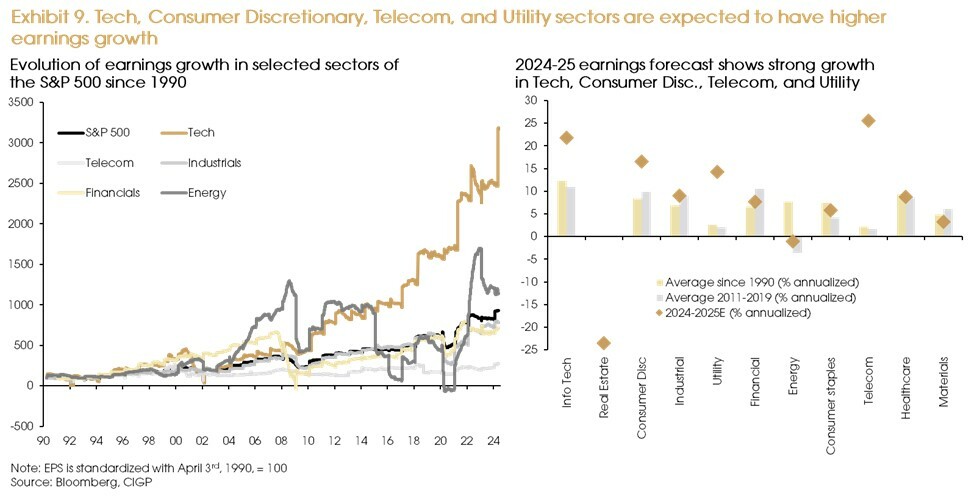
For long-term earnings growth, the Tech, Healthcare, Consumer Discretionary, and Energy sectors have outperformed the SP500 Index since 1990 (Exhibit 9, LHS). Earnings growth in the Financial sector was strong before the 2008 crisis but significantly slowed thereafter.
Earnings growth in the Industrials and Consumer Staples sectors are in line with the overall index in the long run. Meanwhile, earnings in Utility, Telecom, Materials, and Real Estate sectors are the long-term laggards.
However, we see some changes after the pandemic.
From 2023 onwards, although Tech and consumer Discretionary retained their role as “earnings engine”, Telecommunications, Industrials and Utilities saw their earnings momentum substantially improving. Estimated earnings for the 2024-2025 period show a similar picture, with Tech, Consumer Discretionary, Telecom, and Utility enjoying much higher growth, well above the historical trend (Exhibit 9, RHS).
We believe this reflects the advance in digitization trend ensuing to the pandemic as well as the more recent AI-related new industrial cycle, led by Tech companies, and spreading to Telecom, Utility, and some Industrial names for adoption and application in a “second stage”. As the new industrial cycle evolves, these areas of the US market should continue to offer compelling investment opportunities.
Now in the context of non-US markets, Europe has been enjoying cyclical tailwinds from better growth momentum and monetary easing. However, on an absolute basis, both economic and earnings growth remain low when compared to the US’s. Moreover, the European market is more subject to policy and geopolitical risks. The French snap election raises near-term uncertainty, while the new fiscal rules (that require member states with budget deficits above 3% and debt-to-GDP ratios over 60% to implement plans to reduce spending) will create medium-term headwinds on growth.
Unlike some, we see the Japanese equity market as tricky. A refrained rate cut cycle from the Fed and monetary tightening from the Bank of Japan (BoJ) will not help to expand valuation further. Earnings growth has picked up. However, it is mostly driven by strong external demand, while domestic demand remains weak. This explains why the BoJ keeps postponing rate hikes: The domestic economy cannot afford it yet.
In the worst-case scenario, where the imported inflation is transmitted to consumer prices, the BoJ could be forced to tighten monetary policy aggressively, leading to a potential triple whammy of stocks, bonds, and currencies. Therefore, we tend to prefer Europe to Japan.
We remain selective on EM equities. The Tech supply chain-related markets, i.e., Korea and Taiwan, should continue to benefit from the AI development. Economies that enjoy structurally high growth from their domestic markets, even under high interest rates (such as India and Indonesia) still offer good investment opportunities. The China+1 beneficiaries, e.g., Vietnam, should see further gains from supply chain diversification.
For China, although downside risks have been significantly reduced (thanks to the recent policy rollout), the reflation process remains slow, limiting the market upside. However, there are opportunities in specific pockets of the market, such as Tech (with improving earnings), selected manufacturing companies (gaining overseas markets), and high dividend yields (attractive in a low growth environment).
Such an overall bullish view on the equities is subject to downside risks. The soft-landing in the US is not a “done deal” yet. We have seen deteriorating signs, which could suggest a deeper downturn. For example, behind the solid labor market data, the labor participation rate has never returned to pre-pandemic levels and has declined in recent months, which could suggest a hidden weakness in the US labor market. Moreover, the budding recovery in manufacturing activities could be derailed if the Fed delays rate cut by too long.
Geopolitical and political risks will continue to affect asset prices. We do not expect the French snap election or the US presidential election to reverse the market’s trend and believe these will only lead to higher volatility. However, any major flare-up of the conflicts in the Middle East/Russia-Ukraine could turn the “bull” into a “bear”.
Therefore, given the end of the rate hike cycle and the risks of a slower economic growth, fixed income assets should be an effective way to hedge downside risks.
4. Fixed Income: bullish albeit with lower expectations
Historically, bond investors were able to capture a bigger share of returns upon investing several months ahead of the start of the easing cycle. We statistically note that, investing circa three months ahead of the first rate cut tends to maximise returns.
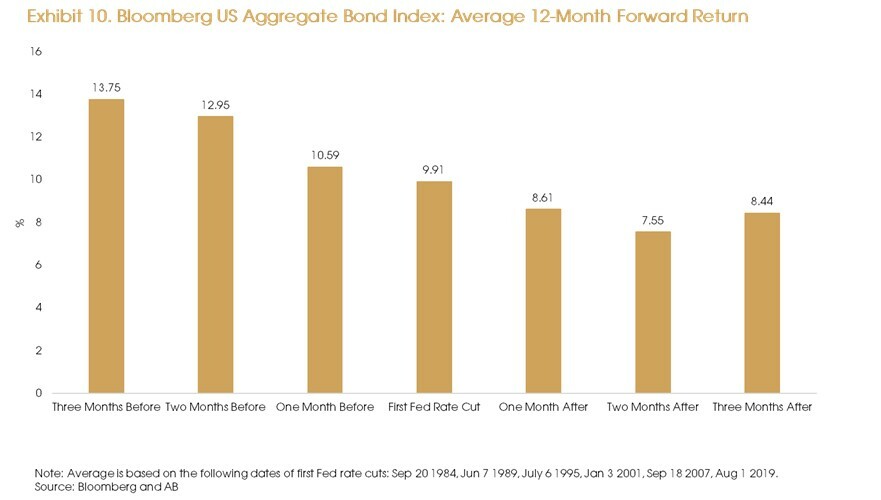
This time around, we anticipate that the potential return to be expected may be less significant than what observed historically due to the possibility of the Fed pausing after the first rate cut, should the economy continue to demonstrate resilience. The Fed may adopt a less aggressive approach to rate cuts to avoid a potential overheating economy as well as a subsequent surge in inflation.
US treasuries have been rangebound between 4%-4.5% this year, we expect treasury yield to head lower eventually, despite the uncertainty surrounding the rate cut. 4.5% would be an attractive level to increase duration, considering that the current 10-year Treasury is trading at 4.25%. However, the U.S elections in November will likely bring the rising debt and deficits back at the forefront of discussion. Nevertheless, our outlook remains positive for bonds, that provide attractive risk-adjusted returns and limited downside risk.
In the European bond market, the ECB initiated its easing cycle before the Fed could adjust its policy stance for lower inflation. The upcoming French election will remain in the spotlight and will be a source of volatility.
The OATs/bund spread has widened drastically and is likely to remain under pressure in the near term. Further widening presents some opportunities. However, it is important to note that the public finance situation in France still poses a potential threat, particularly in light of the fact that the future ruling party is yet to be defined. In a scenario within which the far-right or far-left parties secure a majority, it is expected that the spread of 10-year OATs/bunds would further widen to 100-110 bps (depending on their policy platform). The BTP-Bund would likely widen along with the OAT spread. However, if Macron or a coalition excluding extreme parties secures a majority, the risk-off sentiment is expected to alleviate some pressure on OATs and the spread will potentially narrow to 60-70 bps. Foreign investors’ demand would be another area to monitor since 50% of the French government debt is owned by foreign investors.
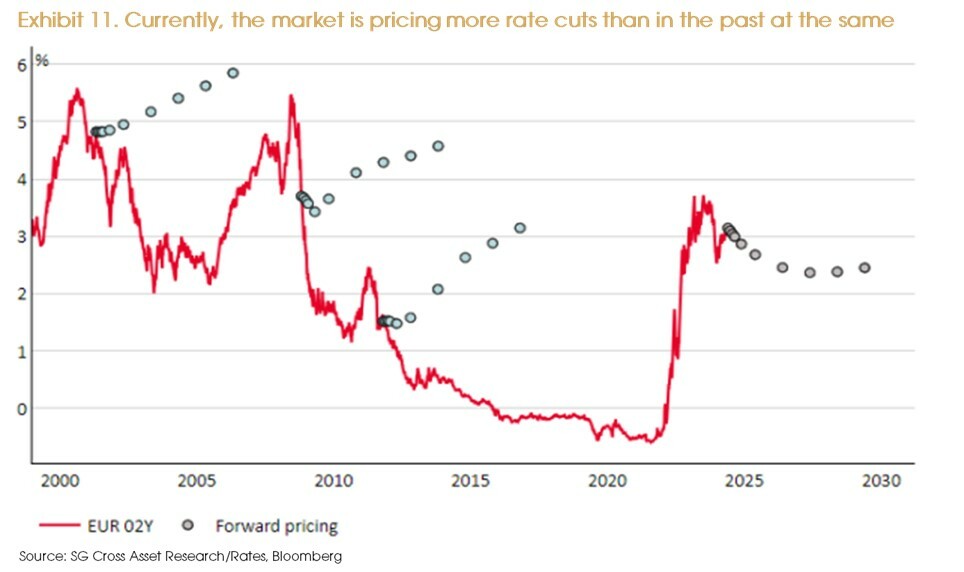
In the previous three easing cycles in the European market, market expectations were relatively conservative following the first rate cut with less inverted yield curves. However, the current market is comparatively pricing more rate cuts than observed historically at the same stage of the cycle. Currently, the market is pricing a terminal rate of 2.5%, implying 150 bps cuts. We therefore maintain a neutral stance on duration in the EUR market unless we see another round of correction.
We expect the 10 Year German Bund to be rangebound between 2% and 2.6% unless a clearer rate cut path is set by the ECB. EUR credit bonds are more appealing than the bund at the time of writing this report.
In terms of HY/Loan investments, both sectors delivered strong returns in 1H24. The HY valuation is still relatively rich underpinned by the overall healthy fundamentals. The rating migration trend has been relatively supportive, while we anticipate a modest slowdown as the current negative outlooks (by rating agencies) outweigh the positive outlooks across most rating cohorts. US high yield spreads remain very tight versus European high yield. As the loan default is expected to trend up modestly and peak in 2025, we should therefore be selective within this spectrum, despite the all-in yields being very attractive.
Disclaimer
This document is issued by Compagnie d’Investissements et de Gestion Privée Group (“CIGP”), solely for information purposes and for the recipient’s sole use and shall not be further transmitted to third parties. You have been provided with this document in your capacity as Professional Investor(s) as defined in Part 1 of Schedule 1 to the Securities and Futures Ordinance (Cap. 571). If you do not meet the Professional Investor criteria, please disregard this document.
CIGP does not assume responsibility for, nor make any representation or warranty (express or implied) with respect to the accuracy or the completeness of the information contained in or omissions from this document. None of CIGP and their affiliates or any of their directors, officers, employees, advisors, or representatives shall have any liability whatsoever (for negligence or misrepresentation or in tort or under contract or otherwise) for any loss howsoever arising from any use of information presented in this document or otherwise arising in connection with this document. This document may not be reproduced either in whole or in part, without the written permission of CIGP. Past performance is not a guarantee of future results. There can be no assurance that forecasts will be achieved. Economic or financial forecasts are inherently limited and should not be relied on as indicators of future investment performance.
This document is not a prospectus and the information contained herein should not be construed as an offer or an invitation to enter into any type of financial transaction, nor an act of distribution, a solicitation or an offer to sell or buy any investment product in any jurisdiction in which such distribution, offer or solicitation may not be lawfully made. Certain services and products are subject to legal restrictions and cannot be offered worldwide on an unrestricted basis and/or may not be eligible for sale to all investors. Unless cited to a third-party source, the information in this document is based on observations of CIGP. The information provided is based on numerous assumptions. Different assumptions could result in materially different results. Before acting on any information you should consider the appropriateness of the information having regard to your particular investment objectives, financial situation or needs, any relevant offer document and in particular, you should seek independent financial advice. All securities and financial product or instrument transactions involve risks, which include (among others) the risk of adverse or unanticipated market, financial or political developments and, in international transactions, currency risk. The contents of this report have not been and will not be approved by any securities or investment authority in Hong Kong or elsewhere.
CIGP acts as an agent when recommending or distributing investment products. The product issuer is not an affiliate of CIGP. CIGP is an independent intermediary, because: (i) we do not receive fees, commissions, or any other monetary benefits, provided by any party in relation to our distribution of any investment product to you; and (ii) we do not have any close links or other legal or economic relationships with product issuers, or receive any non-monetary benefits from any party, which are likely to impair our independence to favour any particular investment product, any class of investment products or any product issuer. Neither us nor our group related companies shall benefit from product origination or distribution from the issuers or providers, whether in monetary or non-monetary terms. We do not provide any discount of fees and charges.
Sources: AB, Bank of International Settlement, Bloomberg, CIGP, Citibank, Federal Reserve, SG Cross Asset Research/Rates.


